and Chasing
[Index][Archives]
Northern Tablelands Storm Chase: Saturday 4th February 2006
Report compiled by Michael Bath, Rodney Wallbridge and Dave Ellem
| Storm News and Chasing [Index][Archives] |
Northern Tablelands Storm Chase: Saturday 4th February 2006 Report compiled by Michael Bath, Rodney Wallbridge and Dave Ellem |
We don't often get the chance to chase in the Northern Tablelands region because when the setup is good there, the North Coast will most likely fire as well. On most other occasions when the Northern Tablelands are certain for storms and not the Northern Rivers, wind shear is often very slack leading to weak pulse storms on the ranges only.
This day was well forecast by the GFS model for a few days out, and given it was Saturday we had all day to devote to a more distant chase. Shear was likely to steer activity further inland as the day progressed and unlikely to produce any storms in the Northern Rivers.
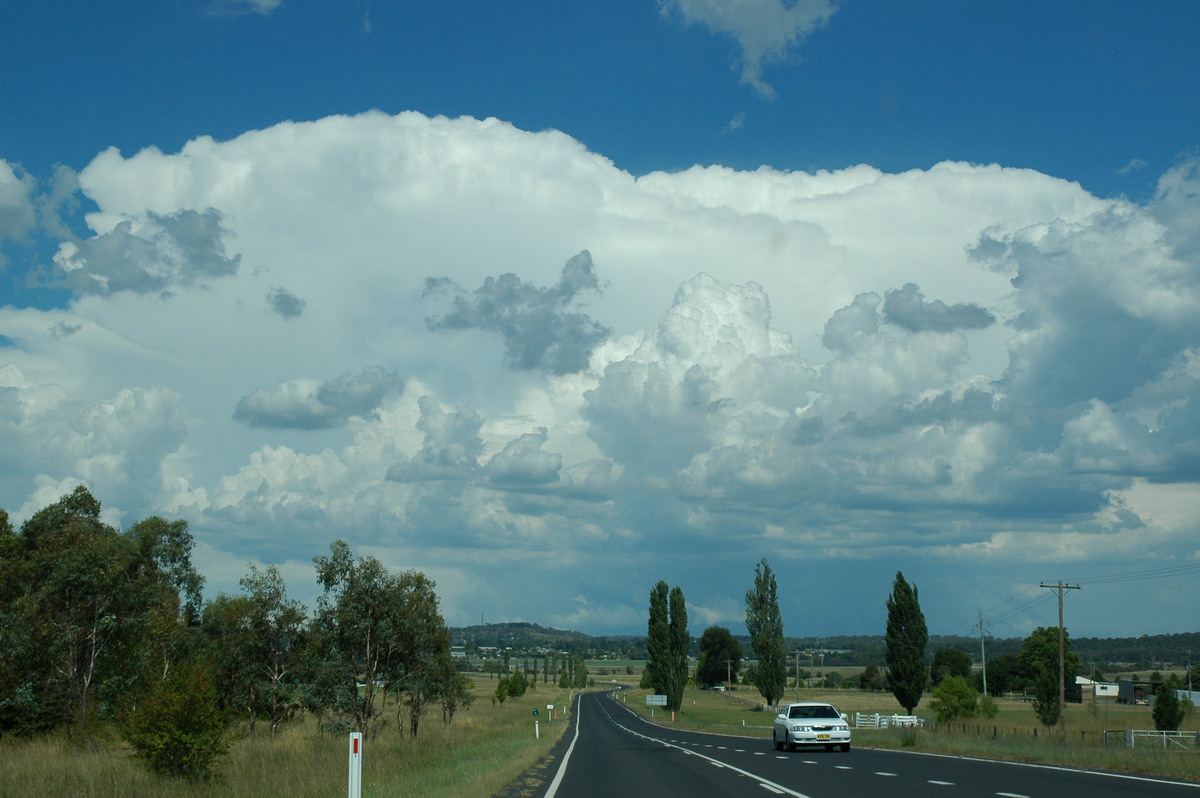
Rodney Wallbridge, Dave Ellem and I left for the Northern Tablelands about 10.45am. We were not expecting any early development due to capping of about 22 @ 850hPa and that was certainly the case.
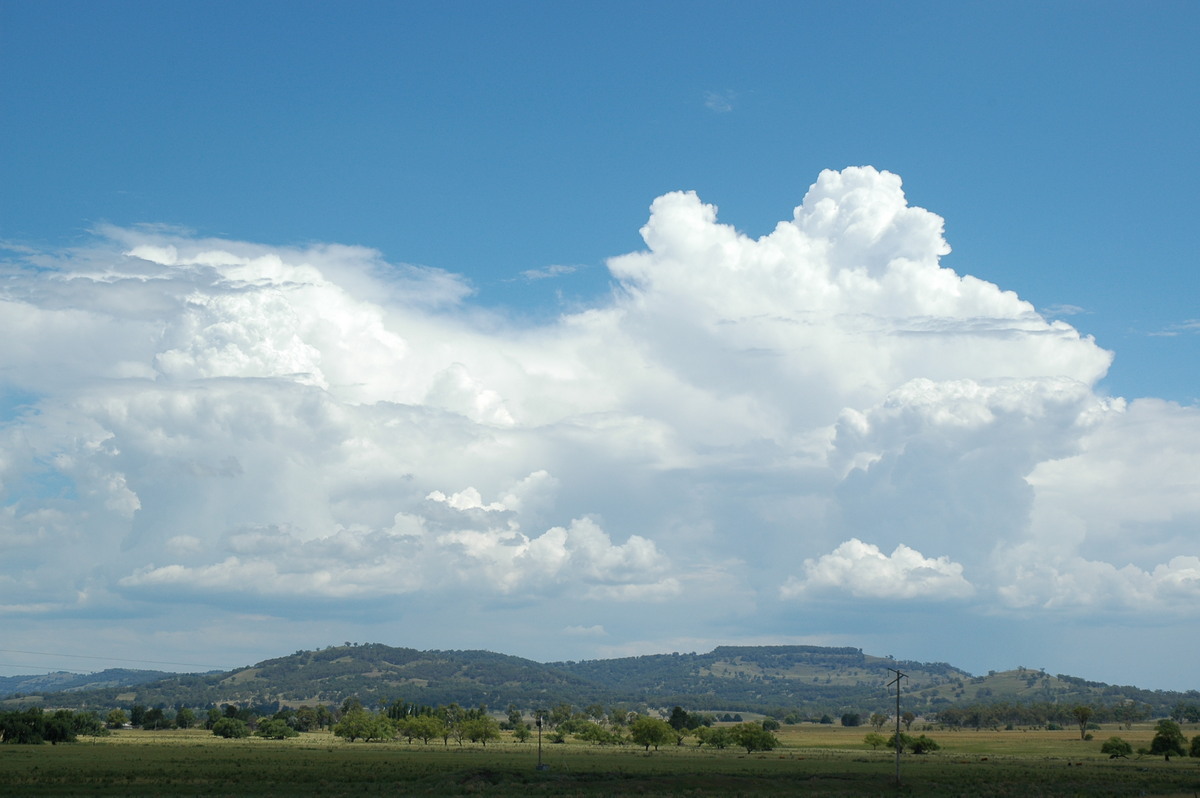
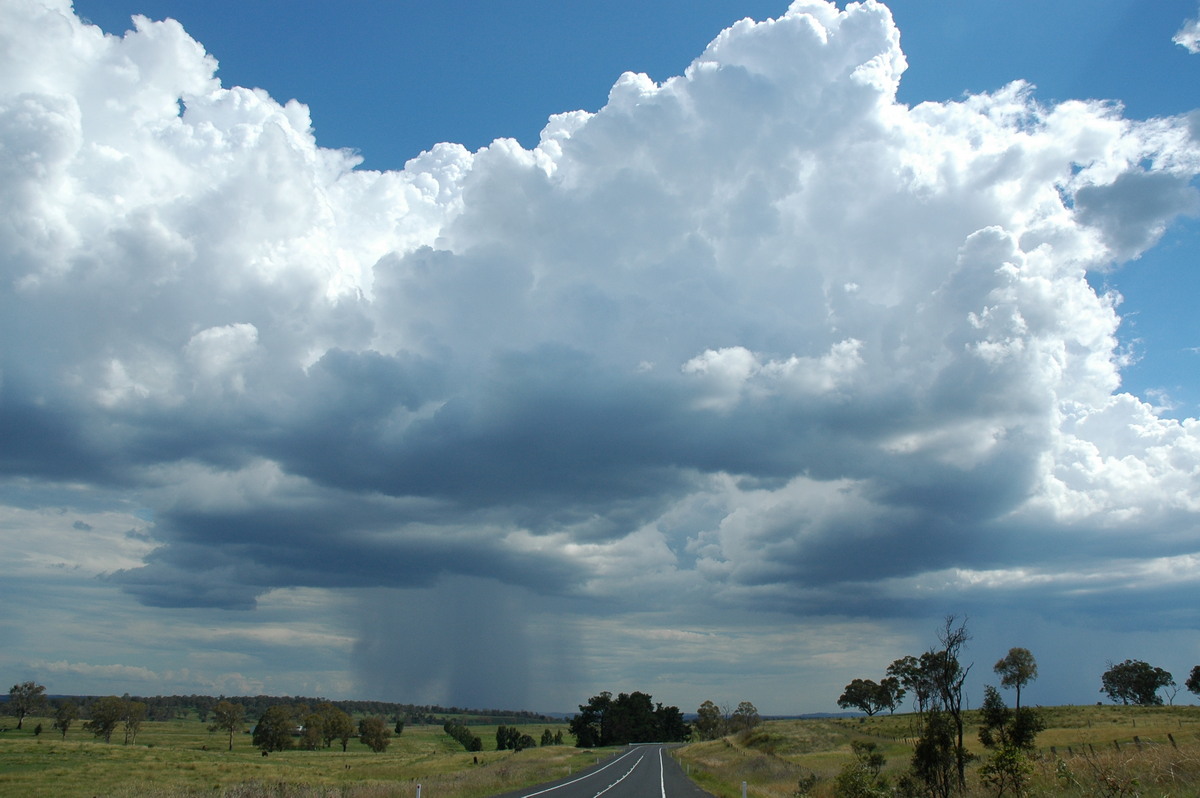
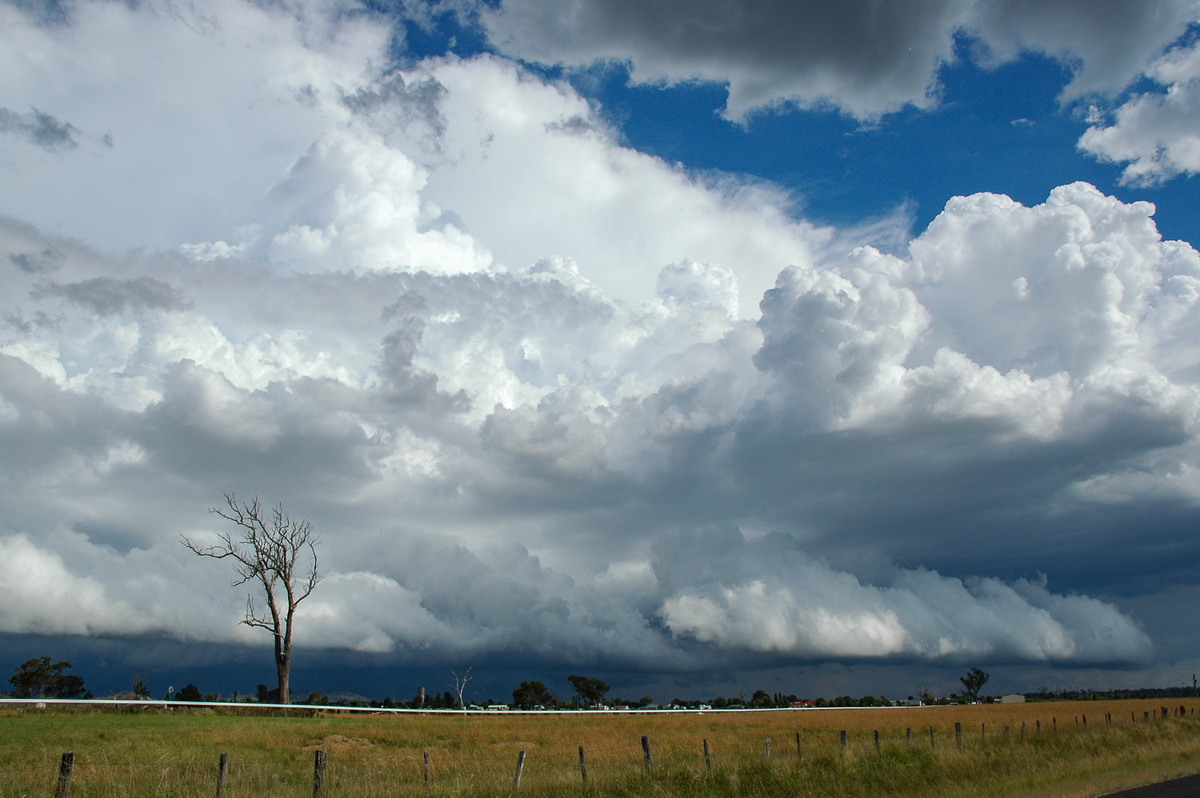
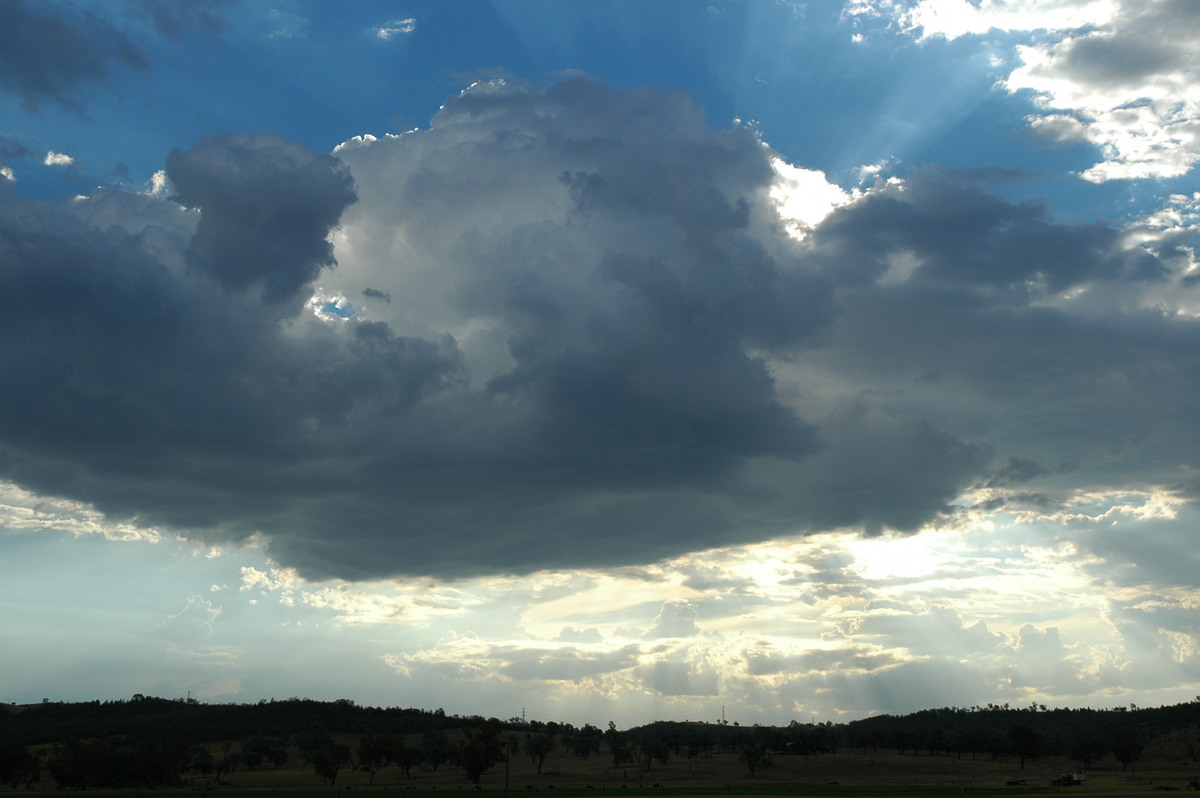
The first towers starting forming close to Ebor during the drive south towards Glen Innes. Some other activity developed SW of town.
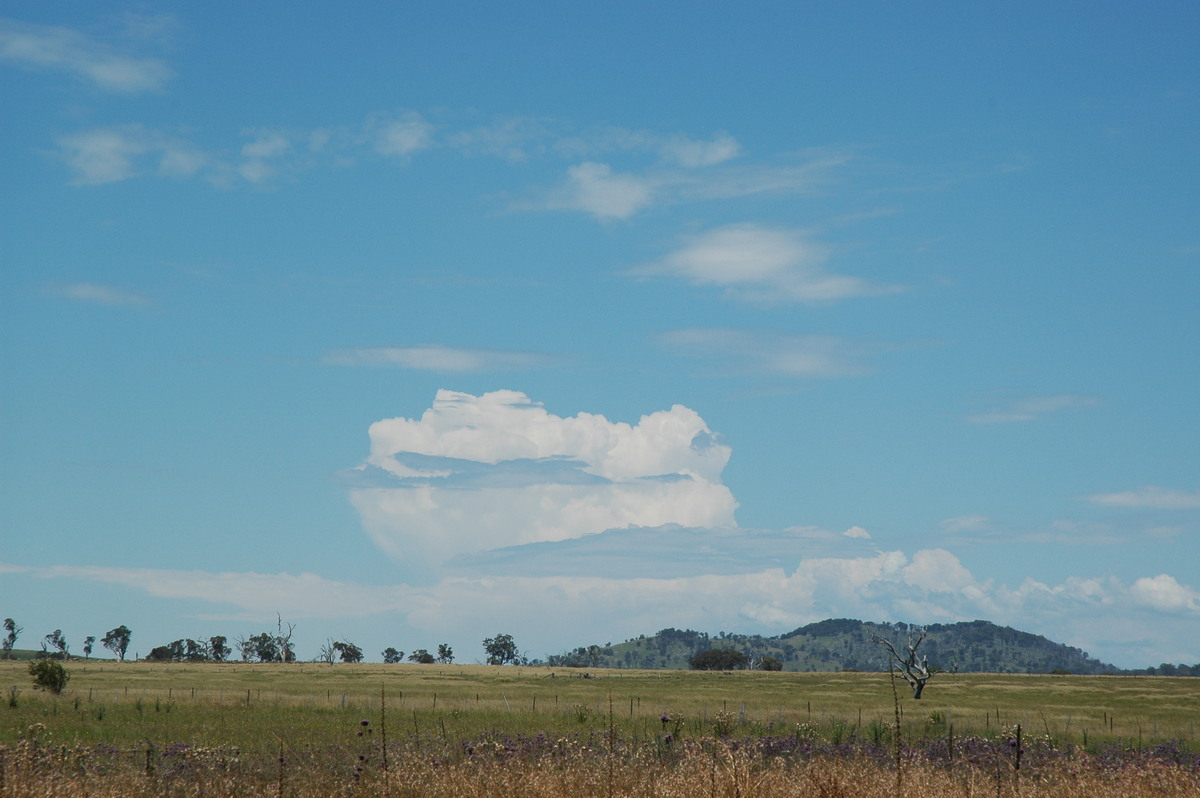
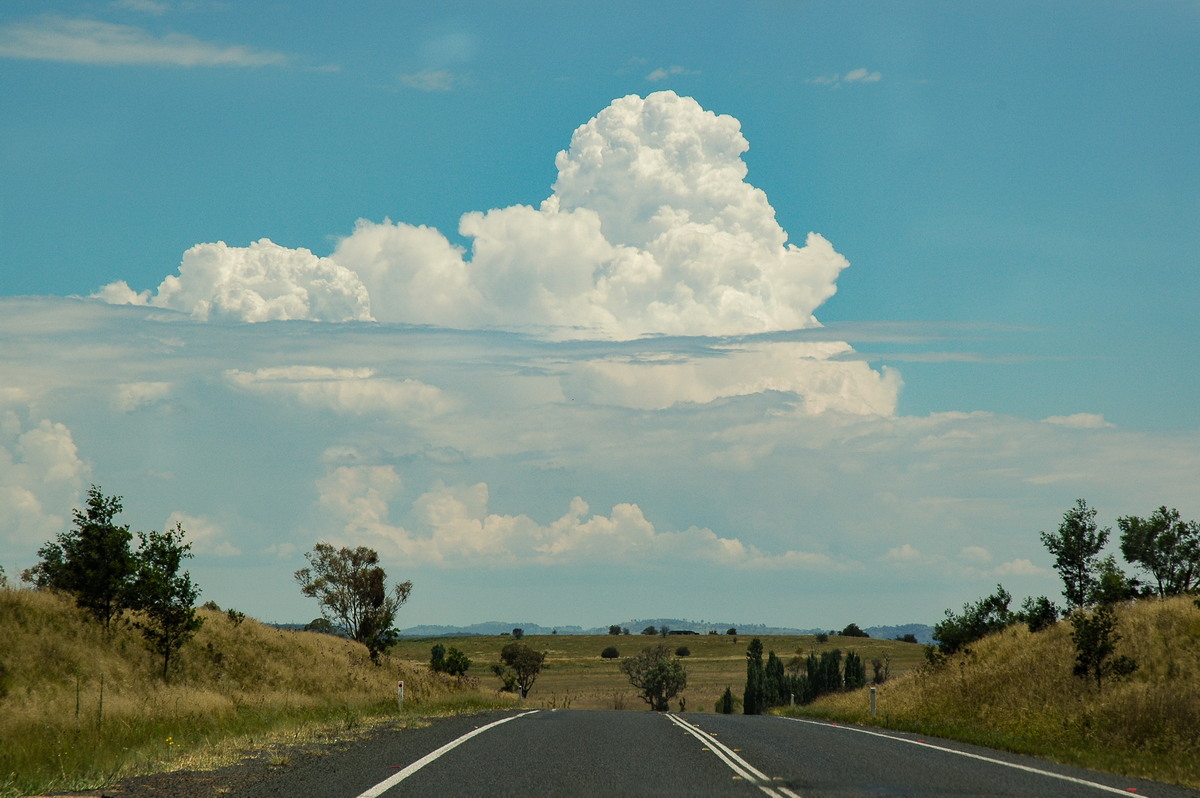
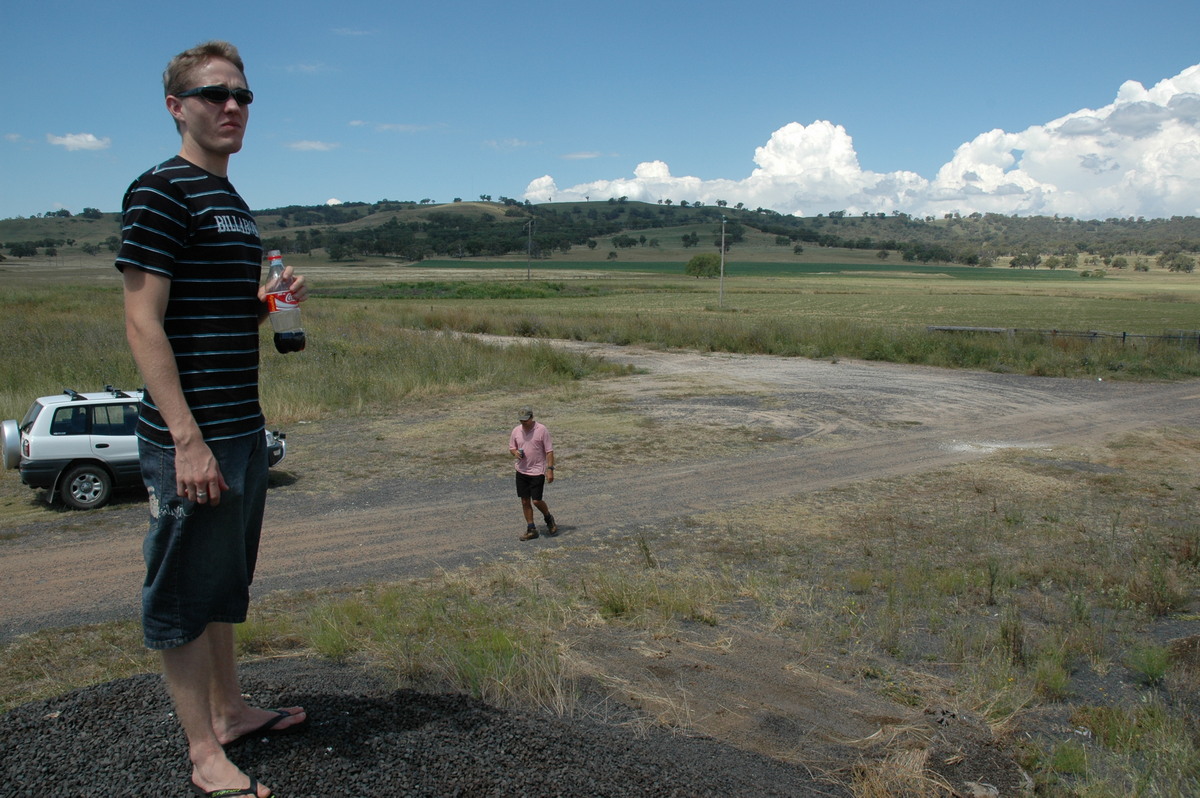
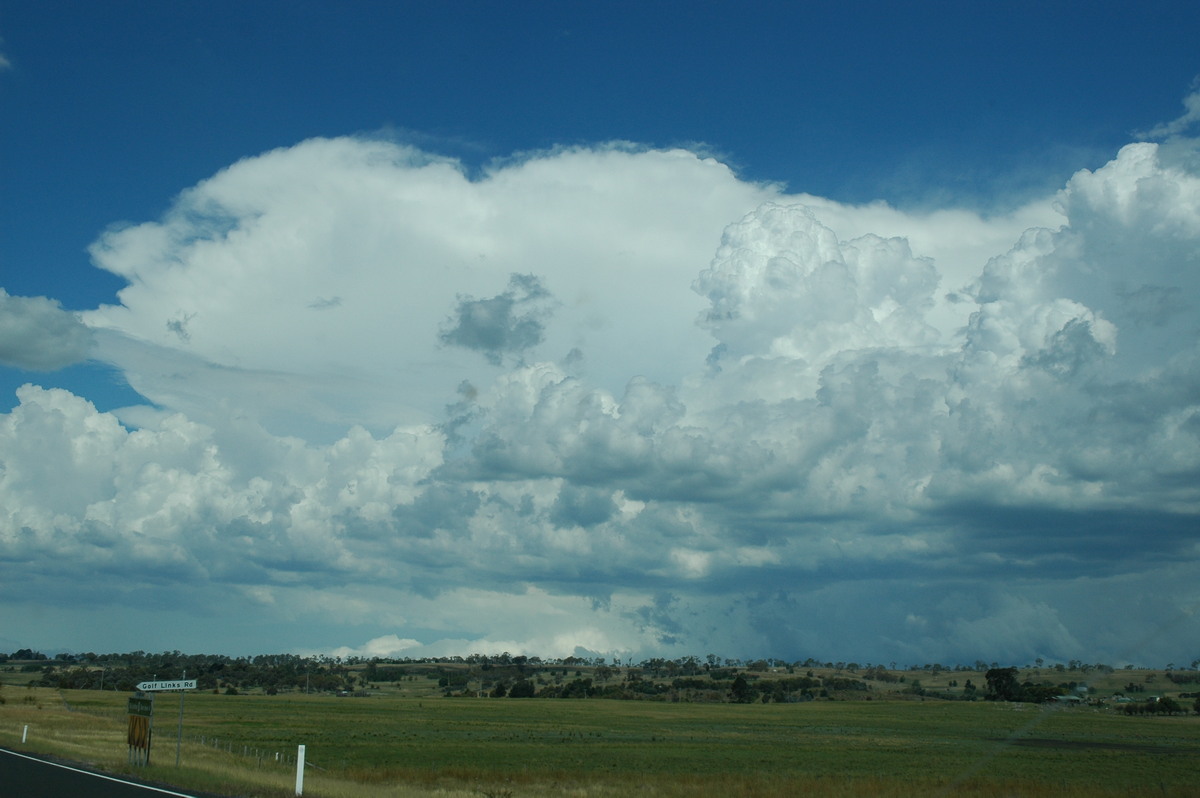
We stopped about 15km west of Glen Innes hoping the southern activity would become dominant and head north. We persevered at this location until about 3pm when strong development to the east led us in that direction.
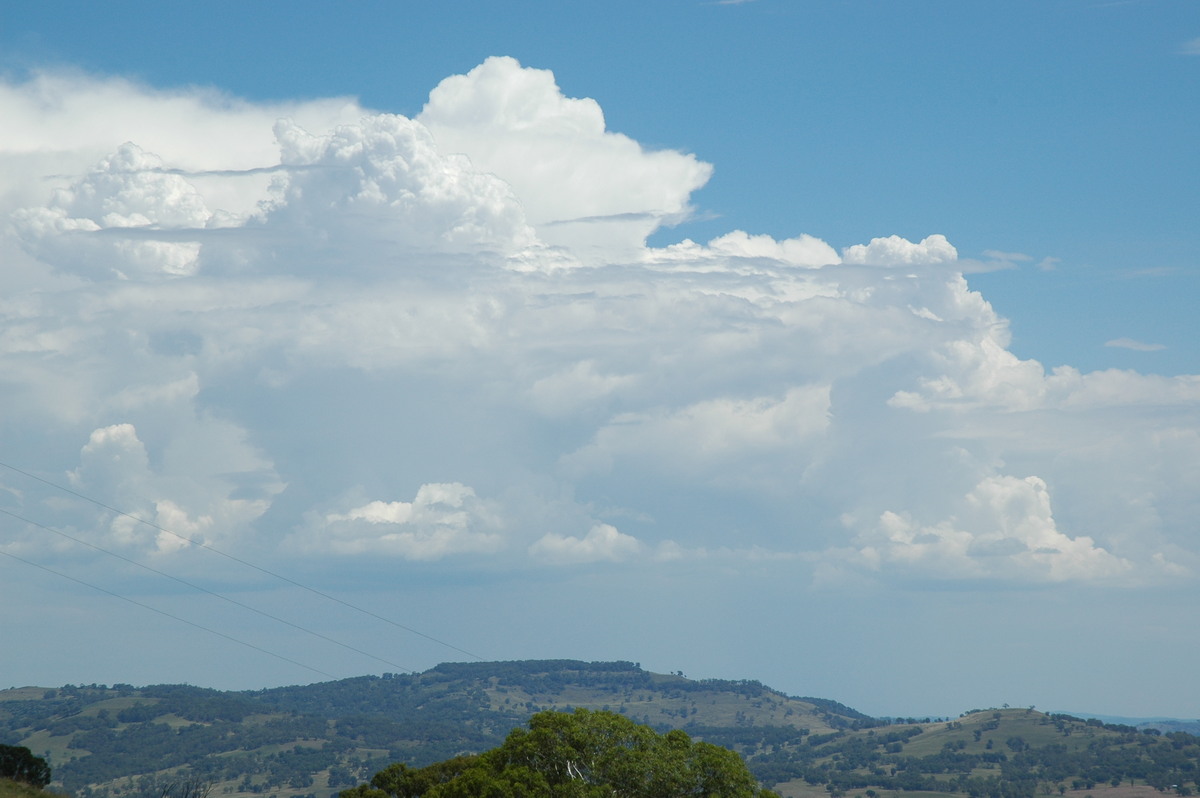
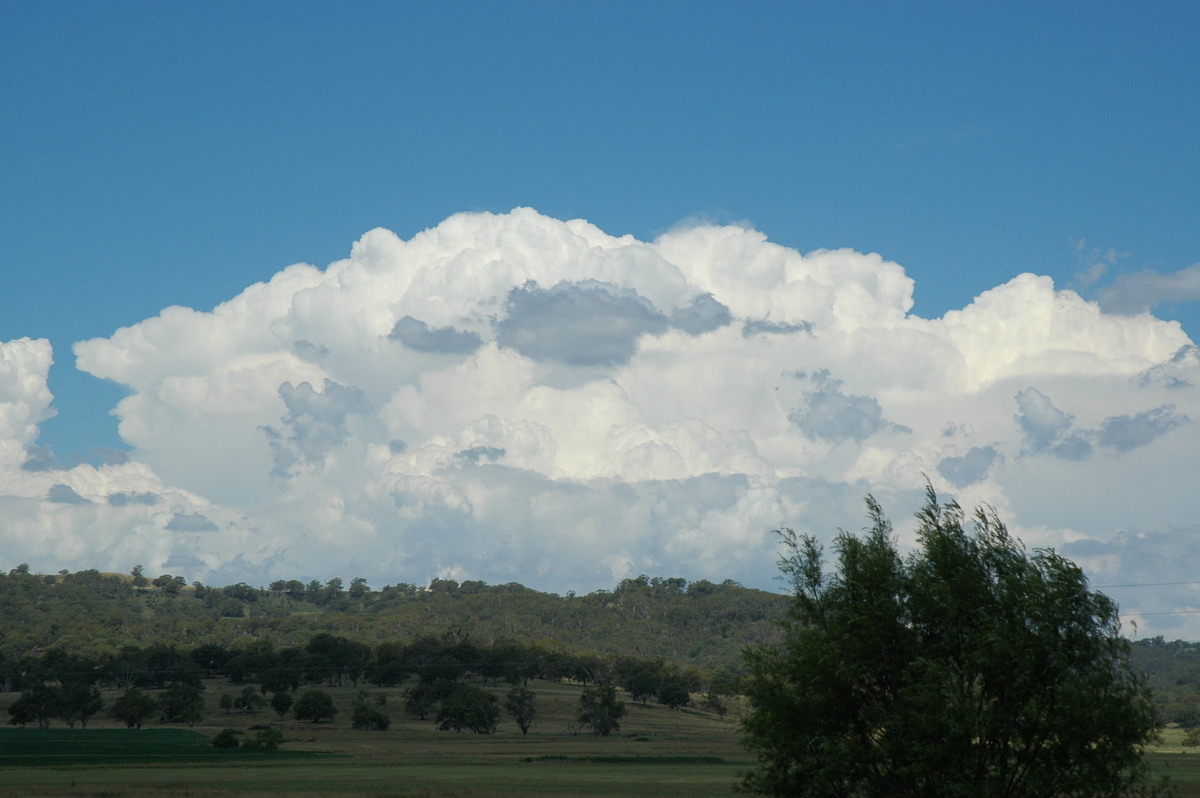
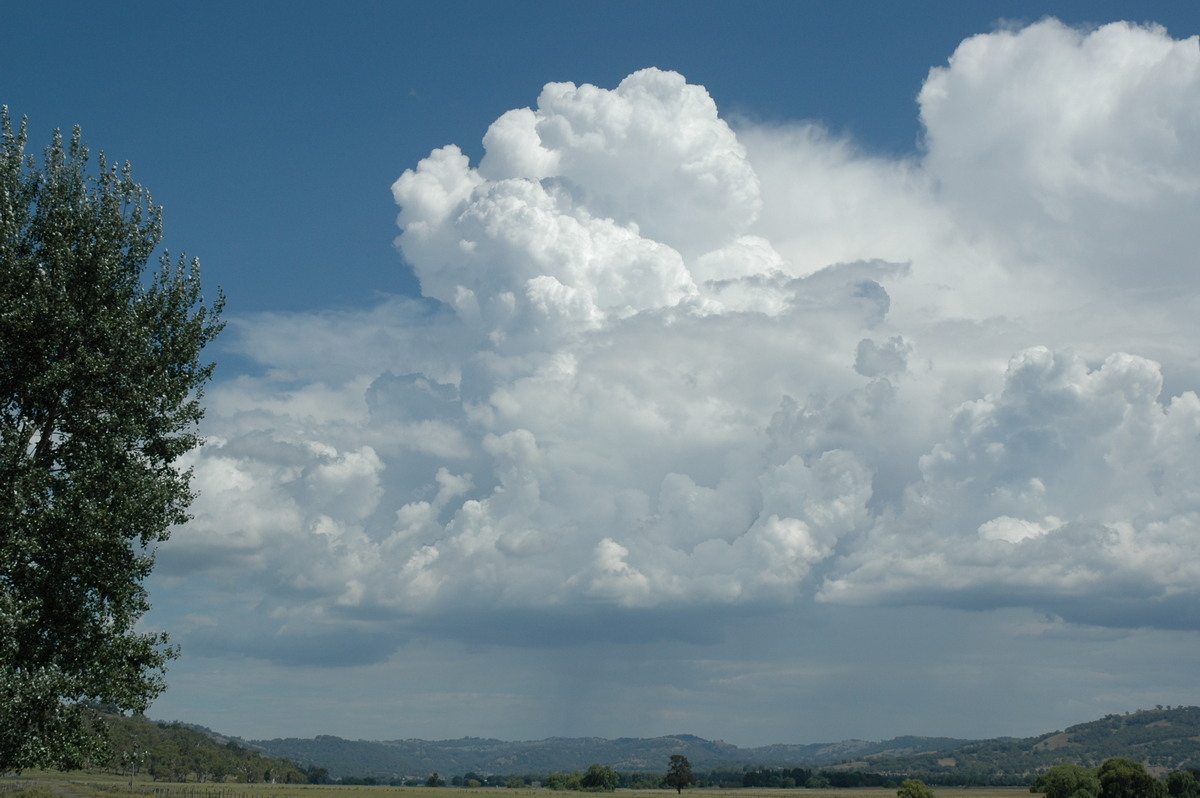
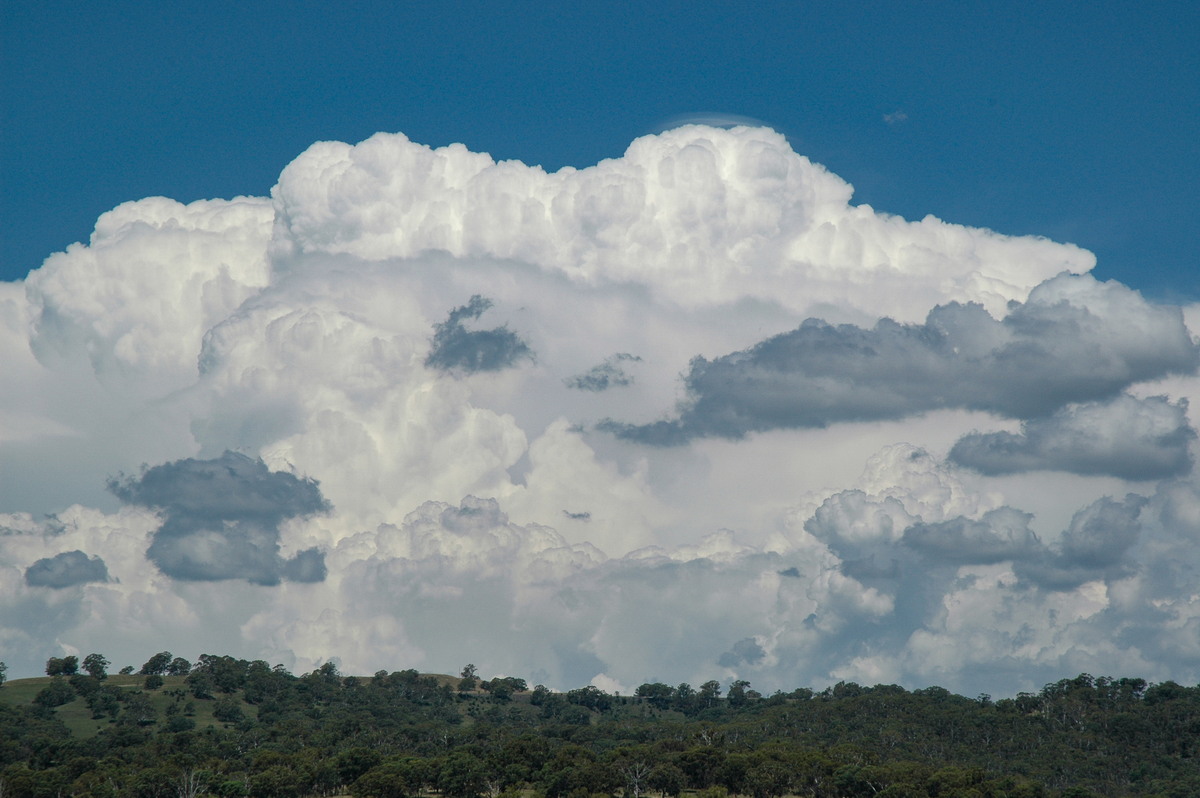
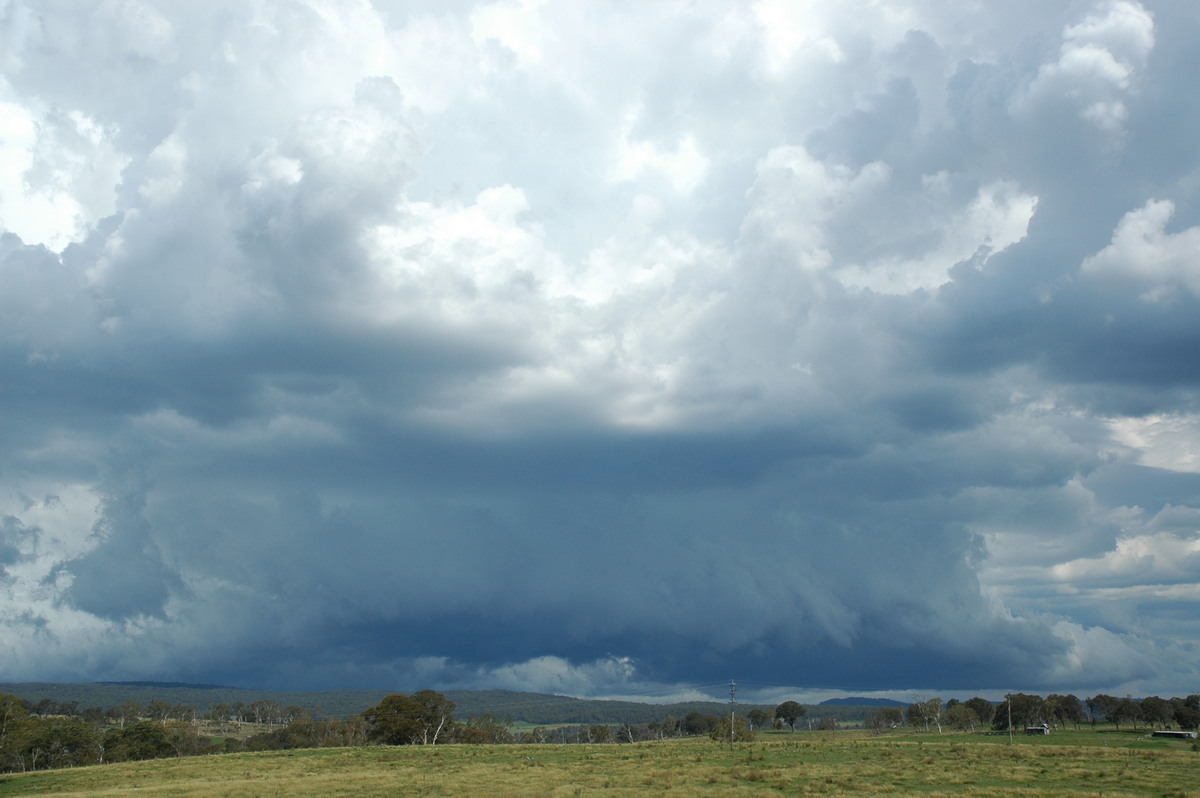
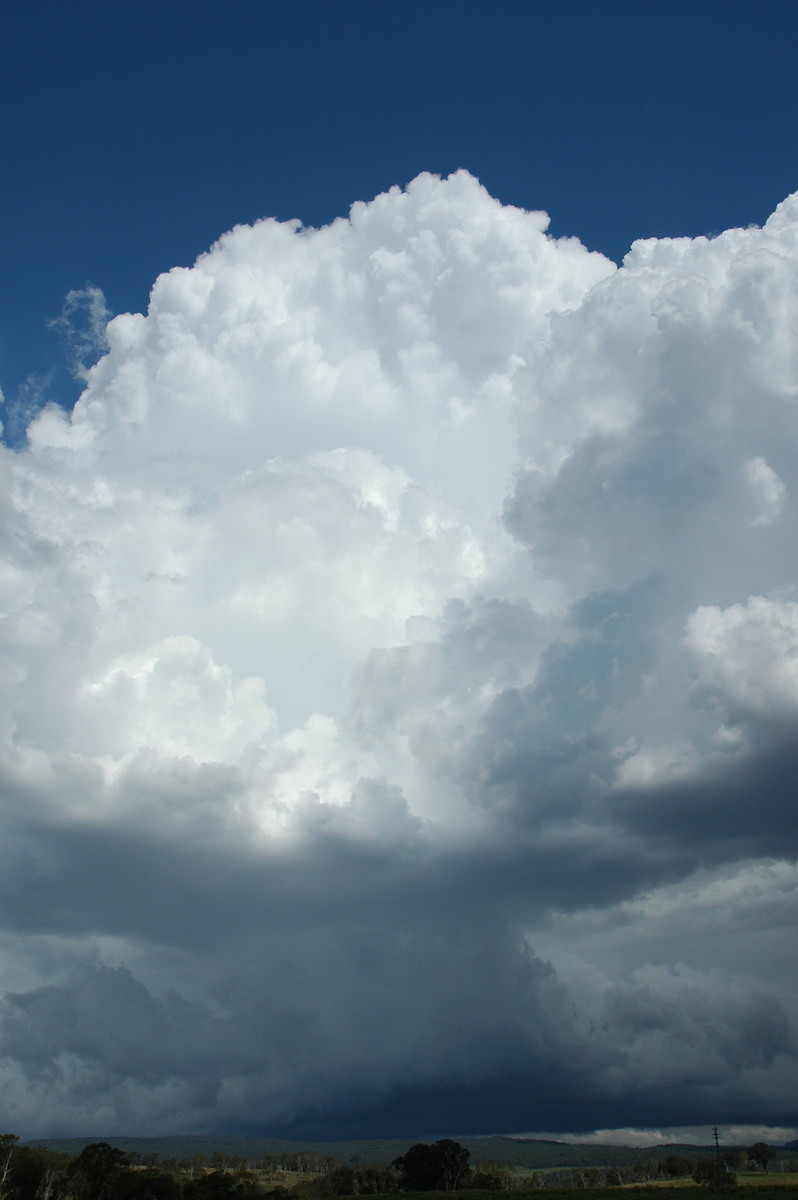
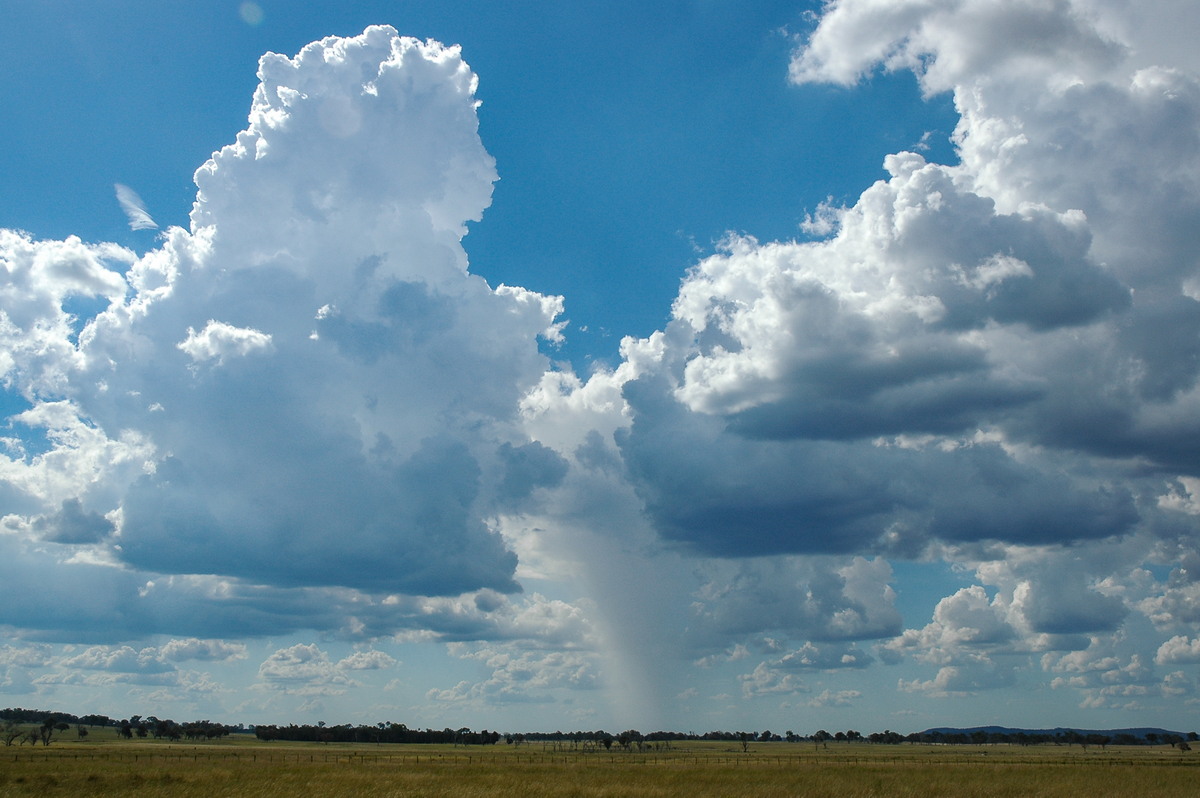
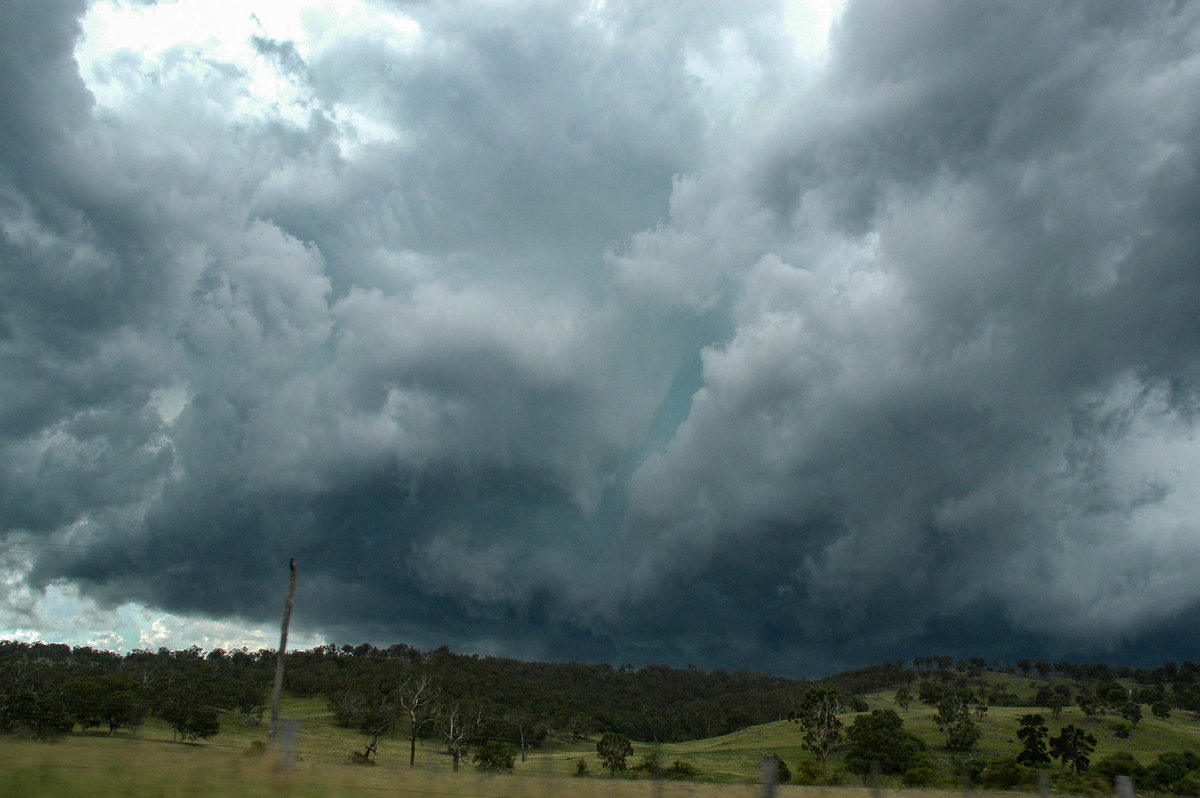
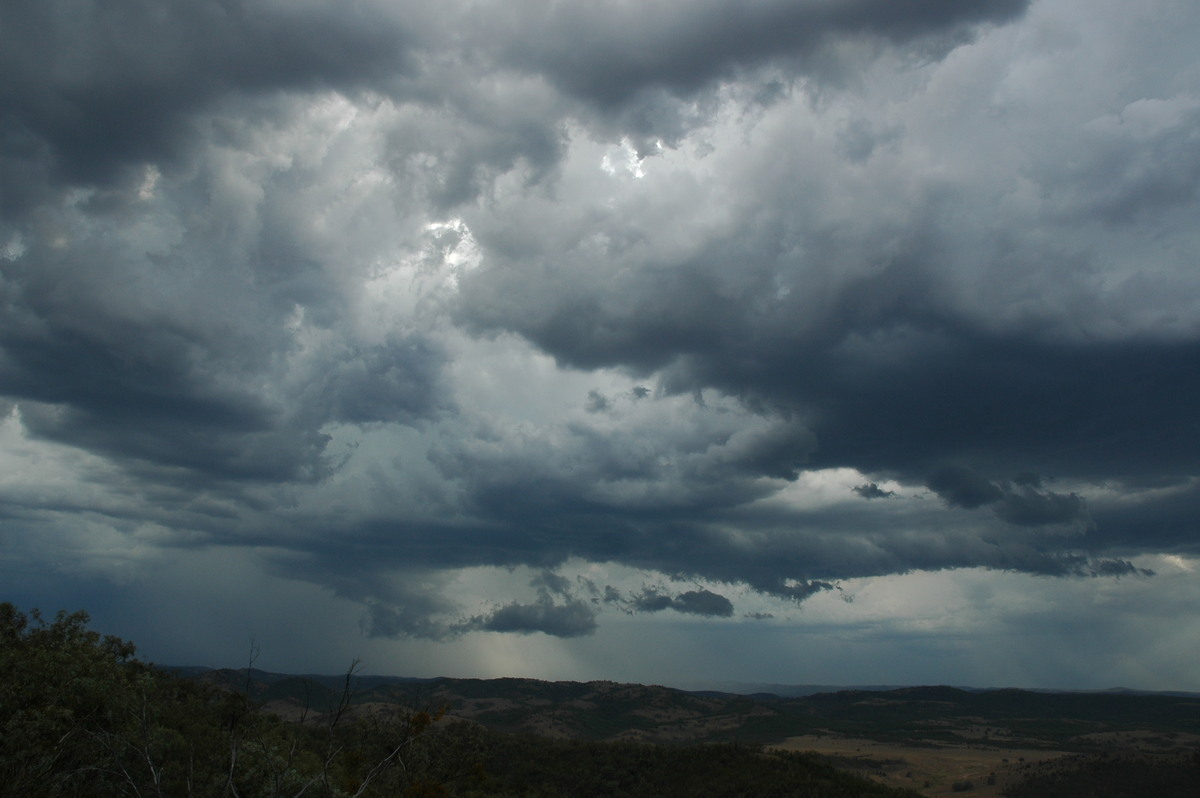
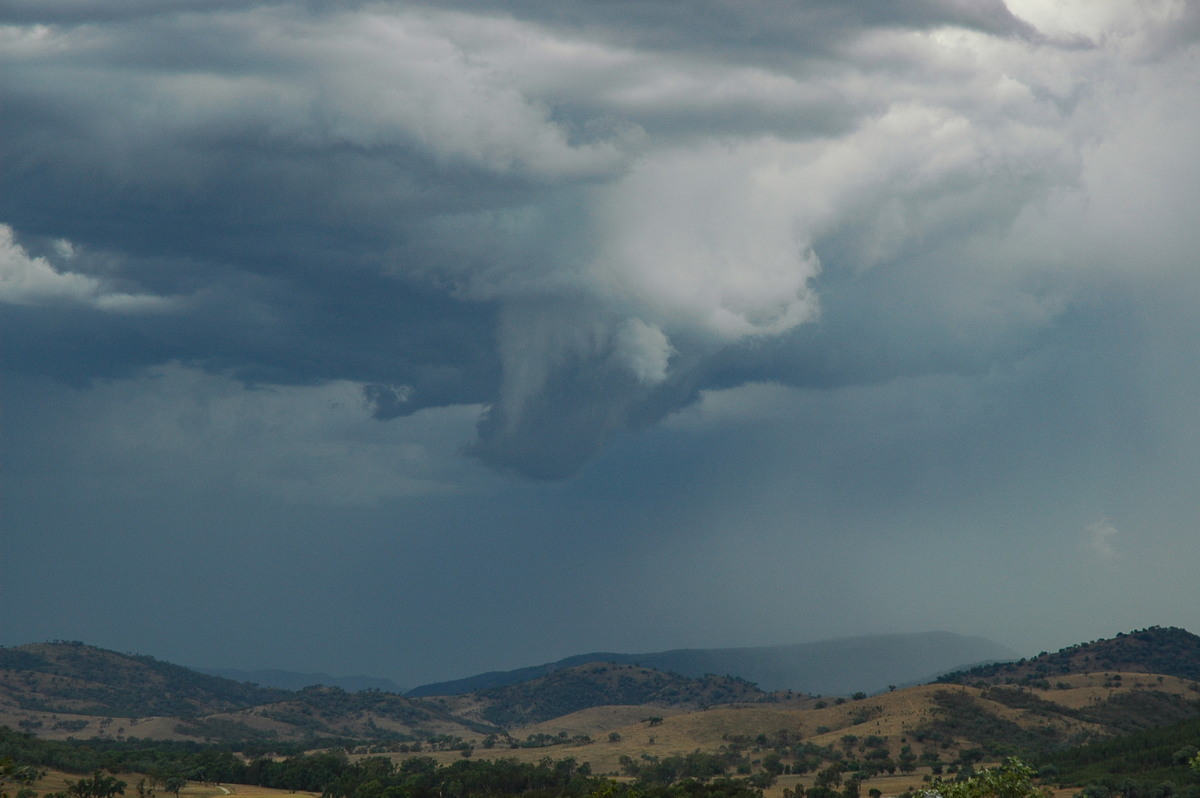
We moved to about 15ks NE of Glen Innes and watched a severe storm approach. Lightning was not particularly frequent but the updrafts and overall structure were very powerful looking.
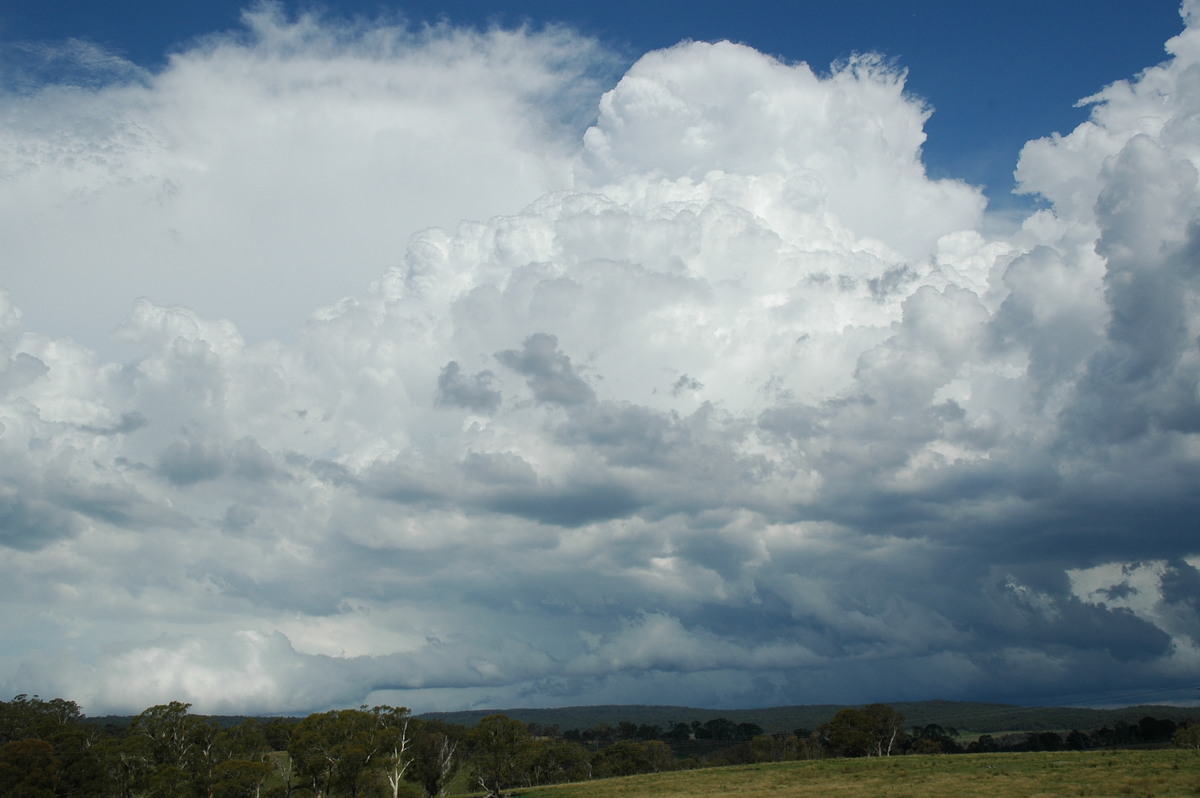
A gustfront developed and spread N-NW, kicking up new cells to the west.
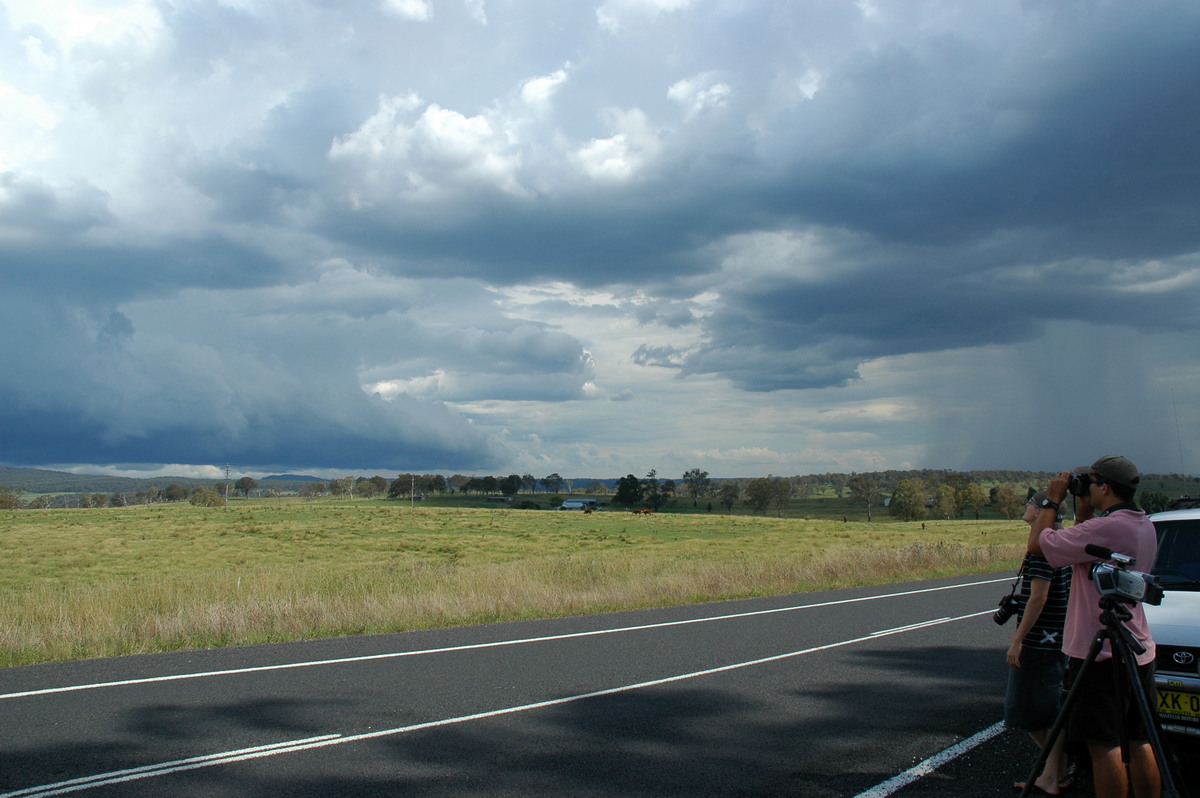
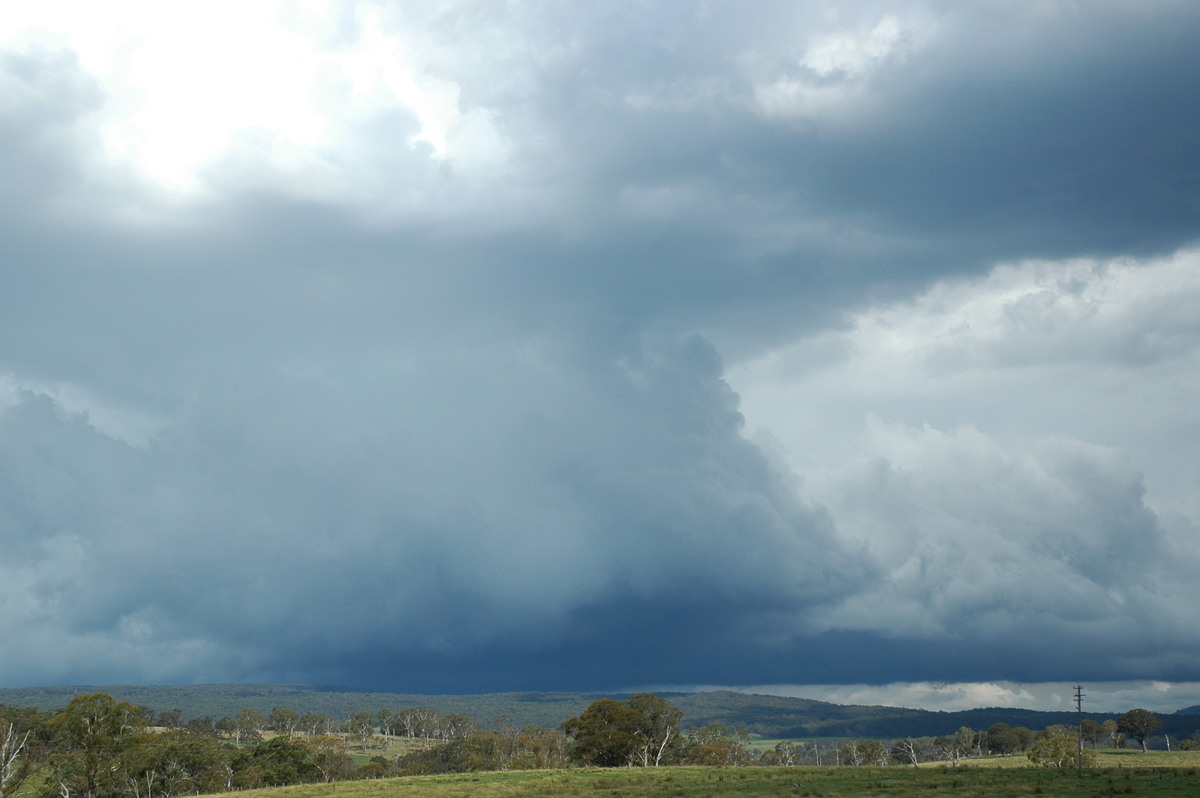
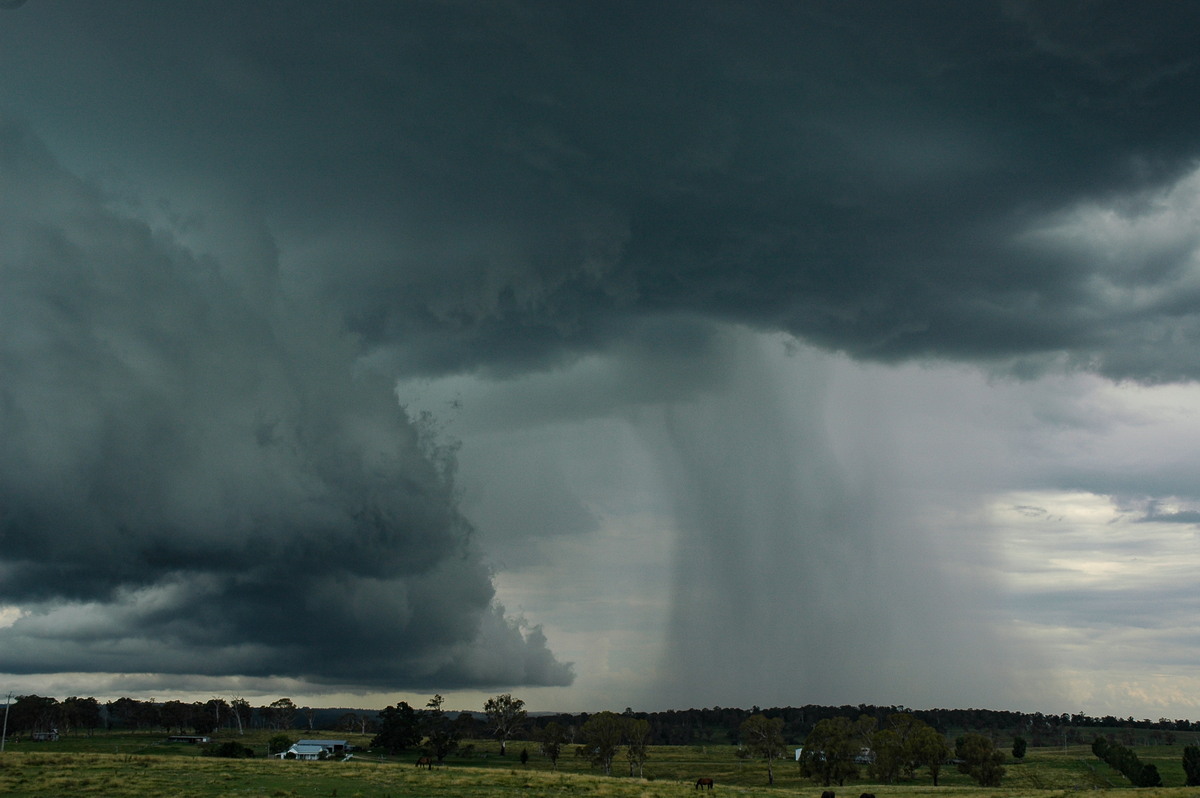
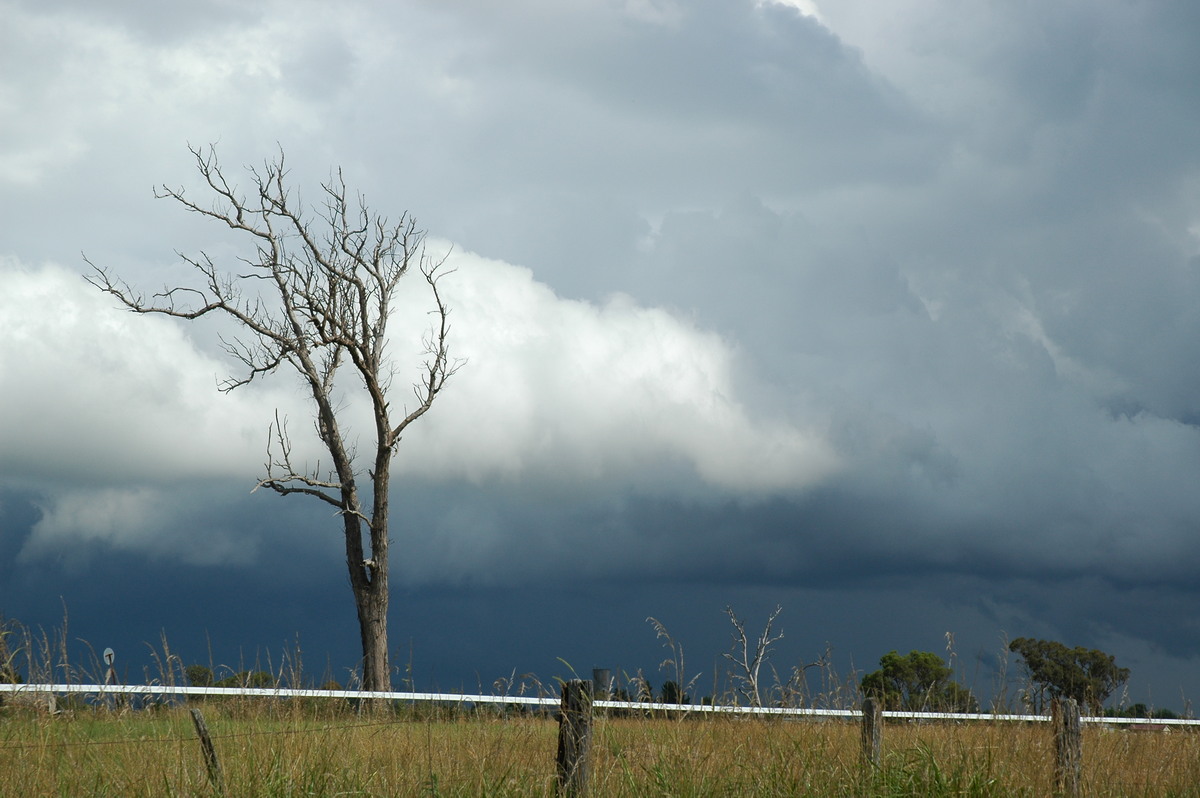
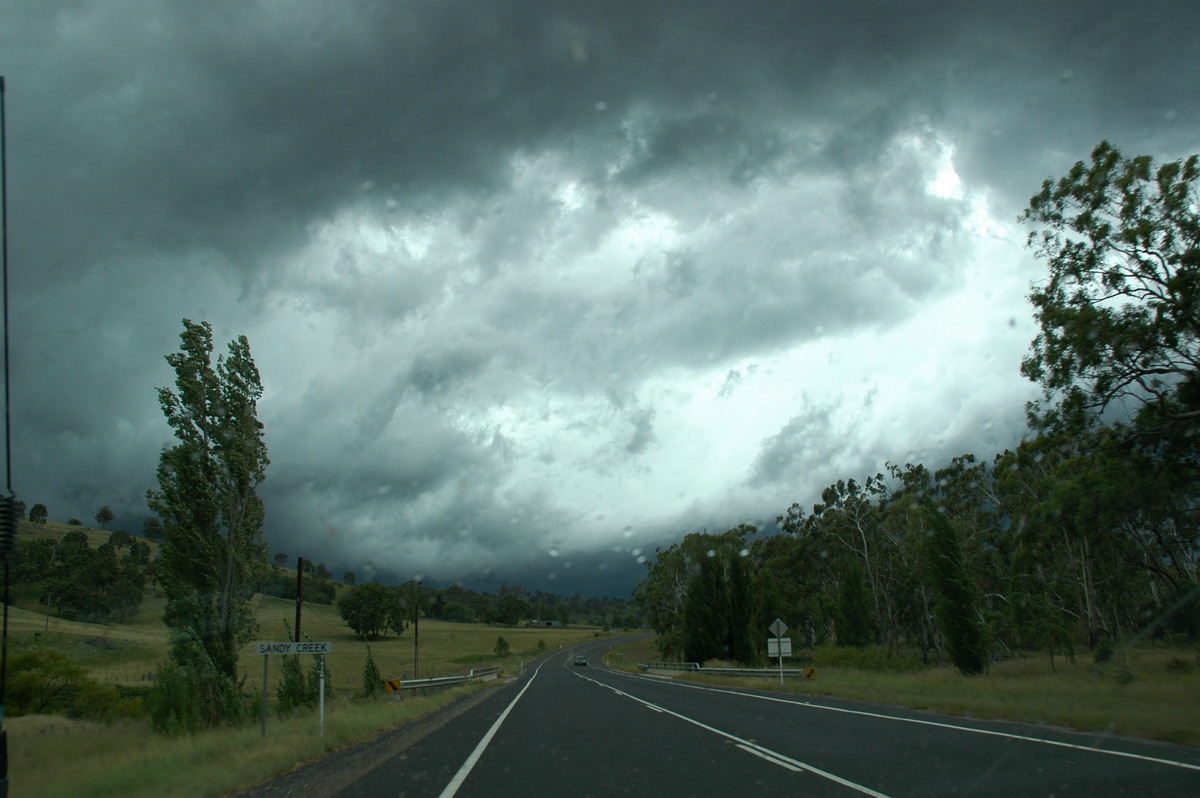
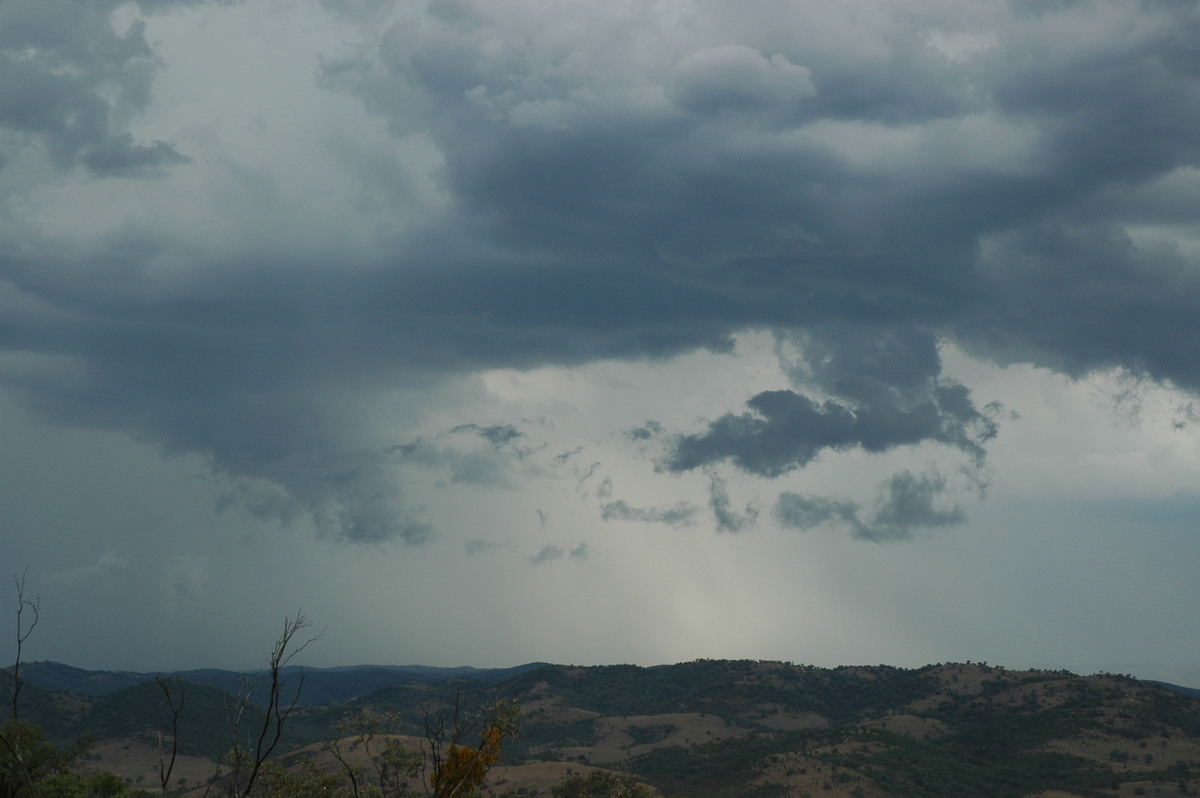
We escaped this area just in time as gale force outflow winds from the SE hit. It was unusual for us to witness a storm with most of its base close to ground level - the terrain is about 1200 metres here.
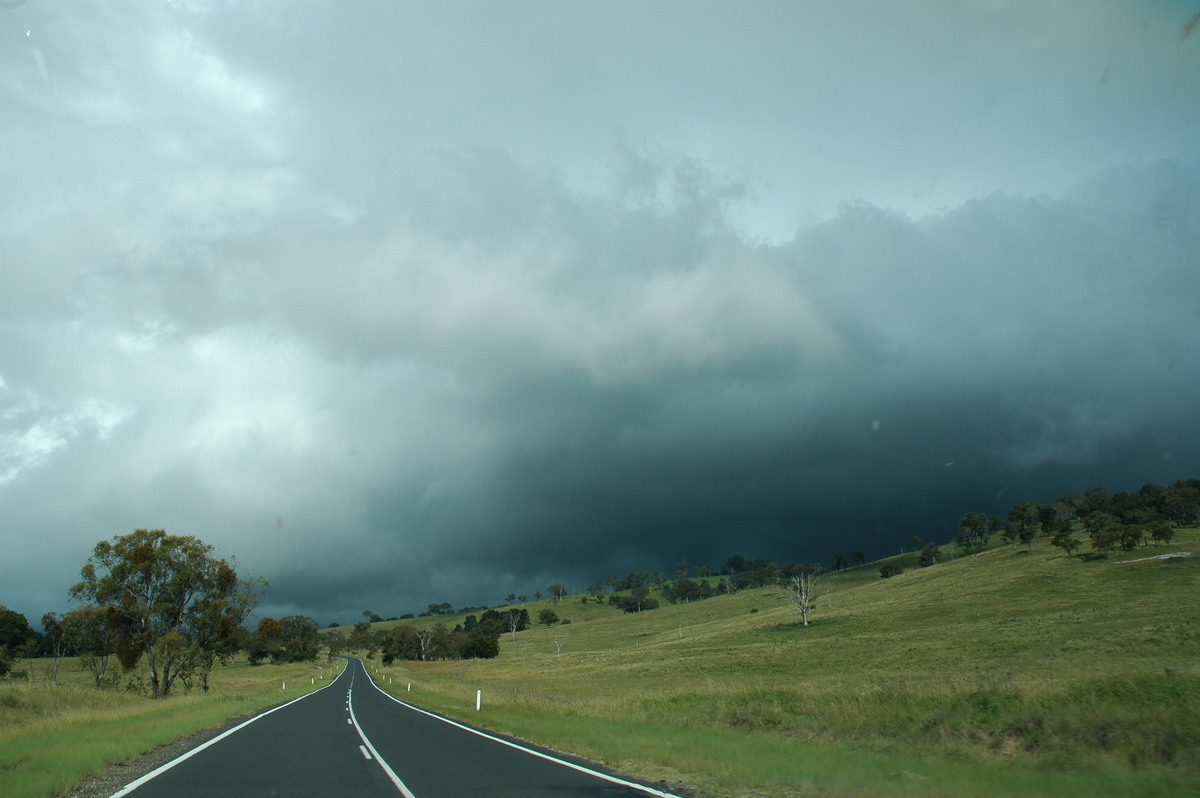
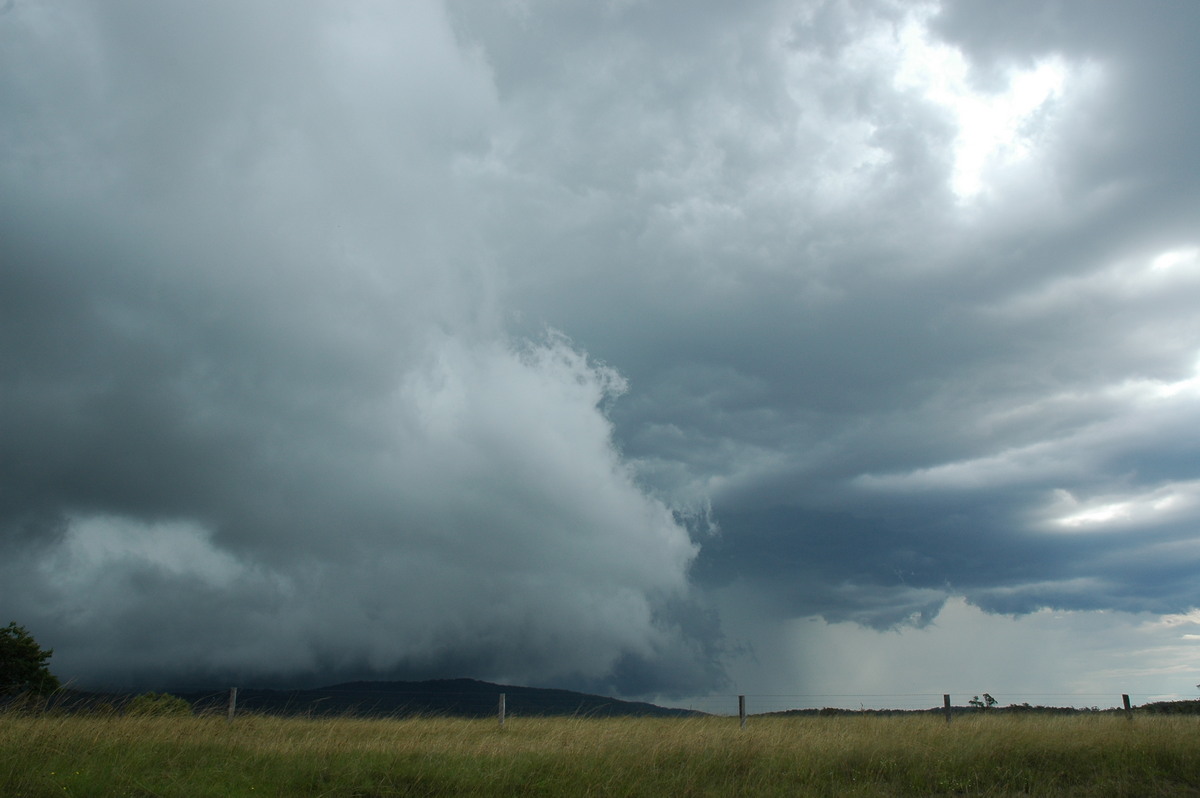
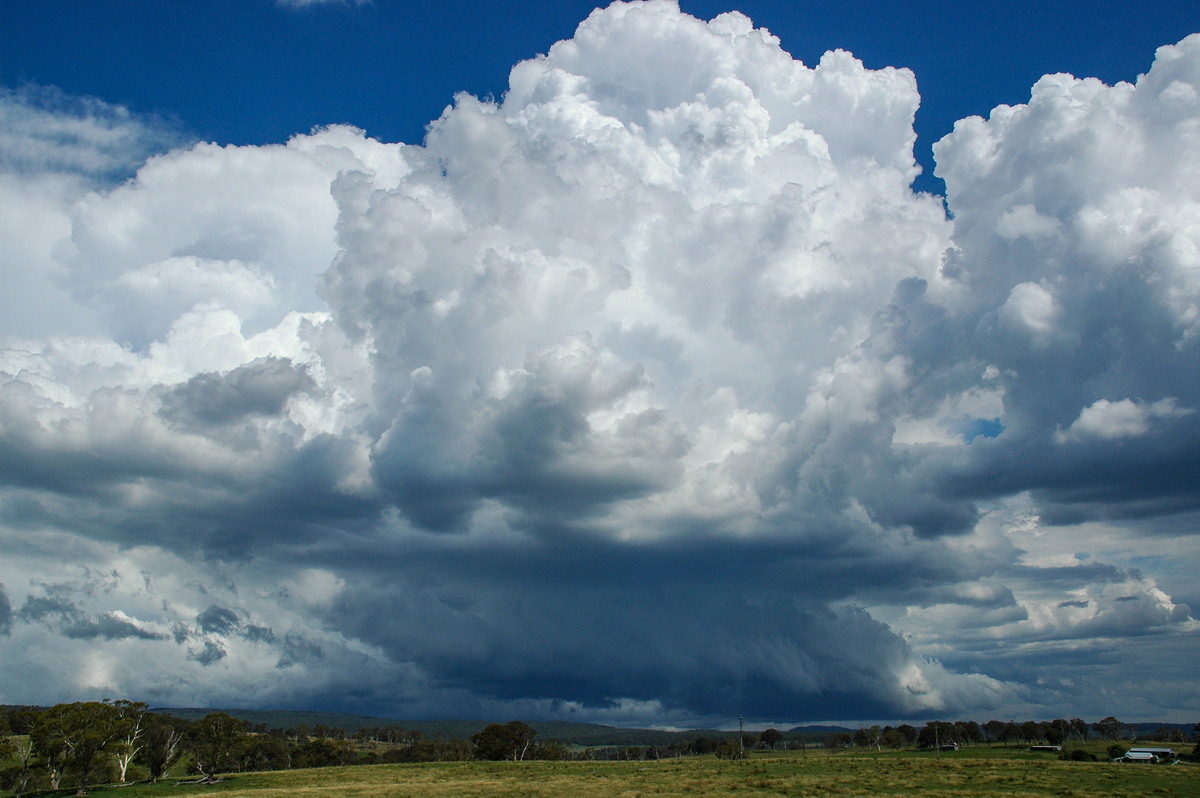
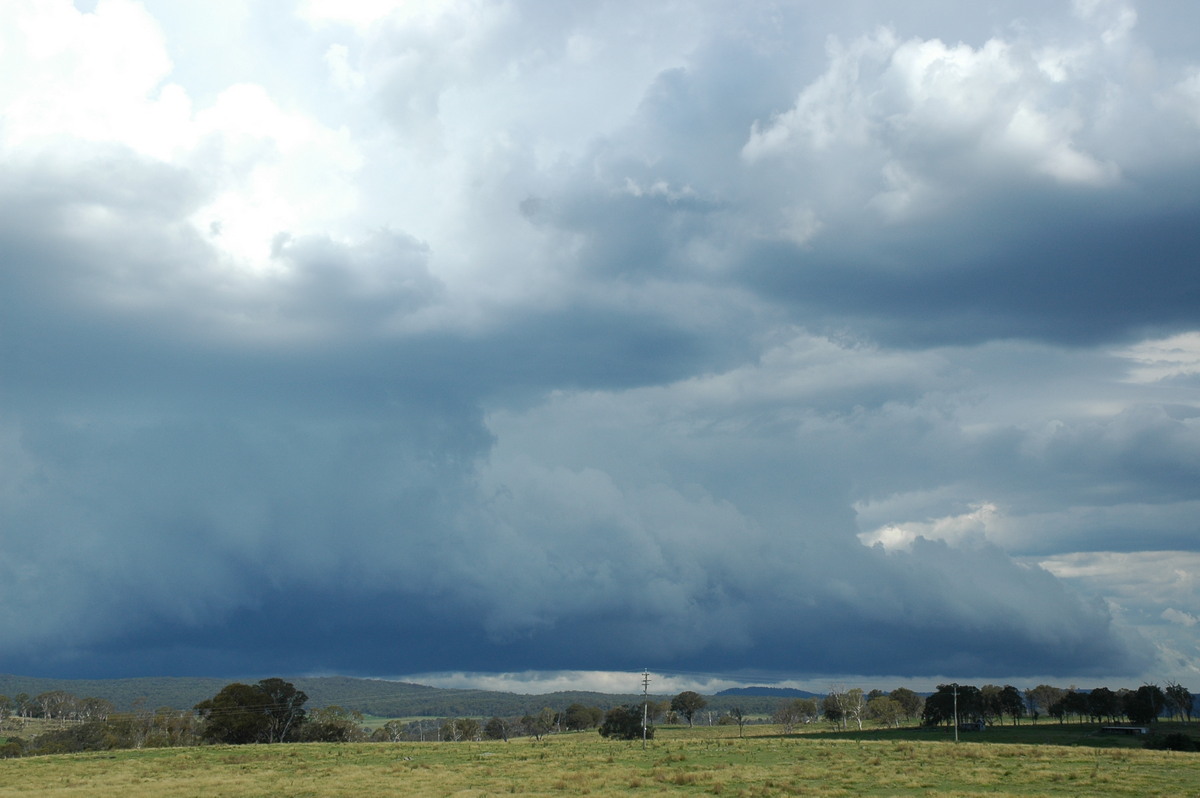
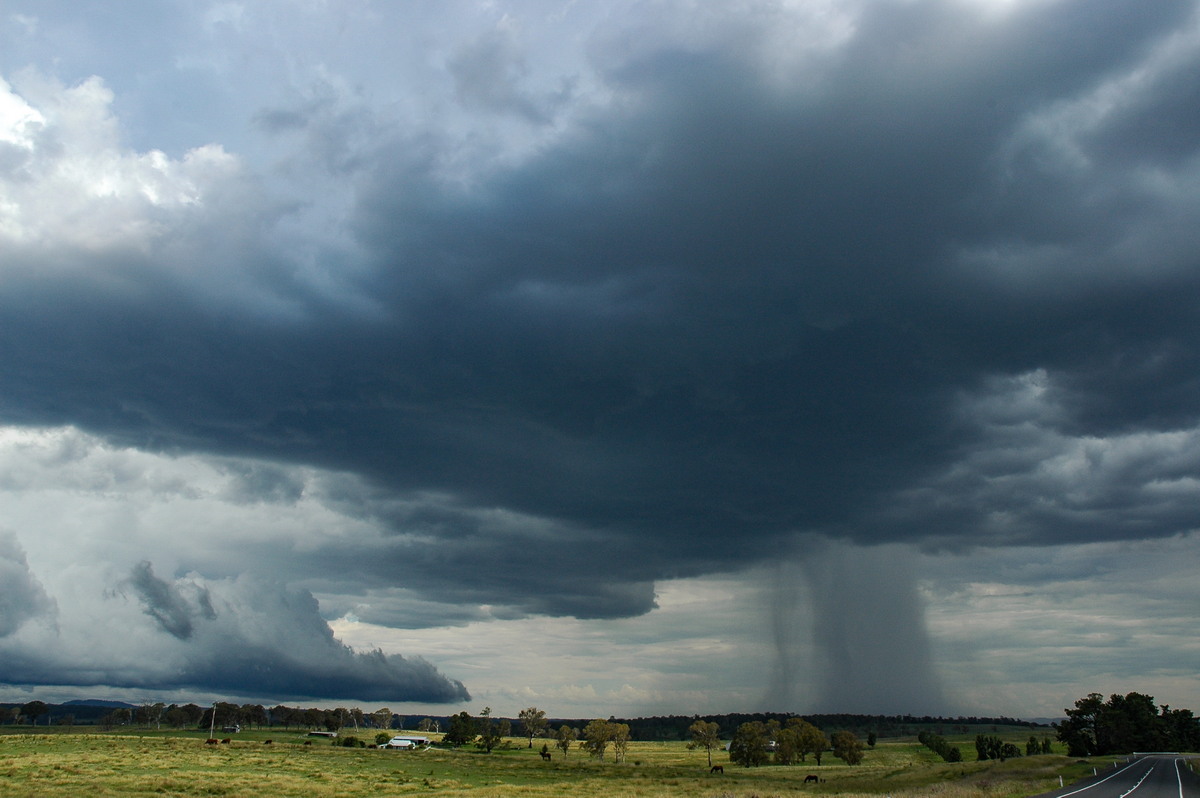
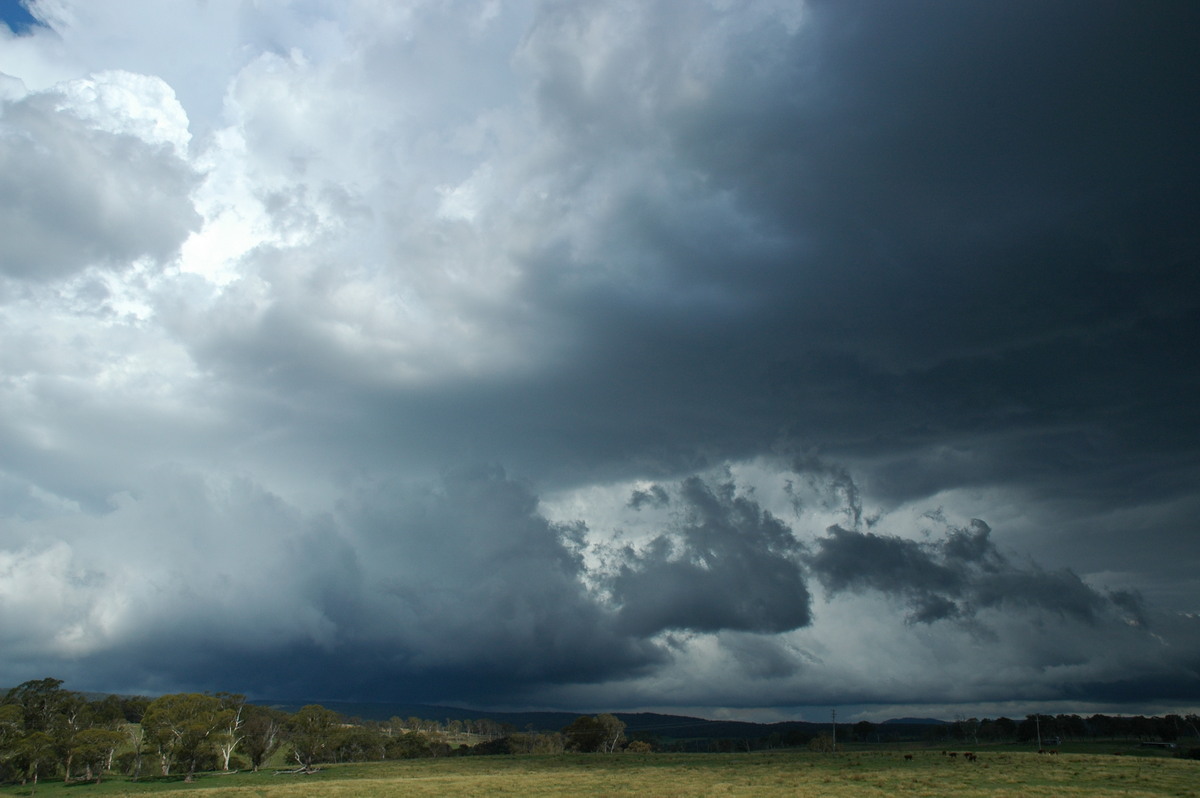
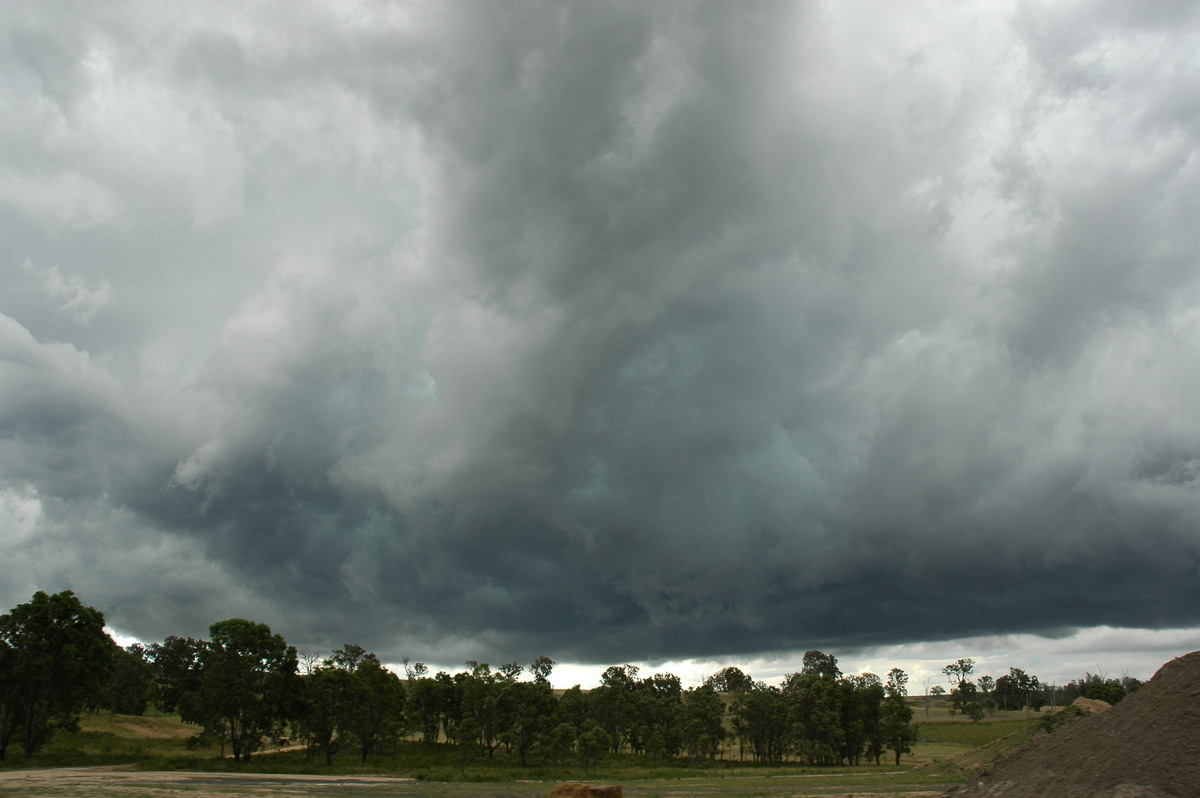
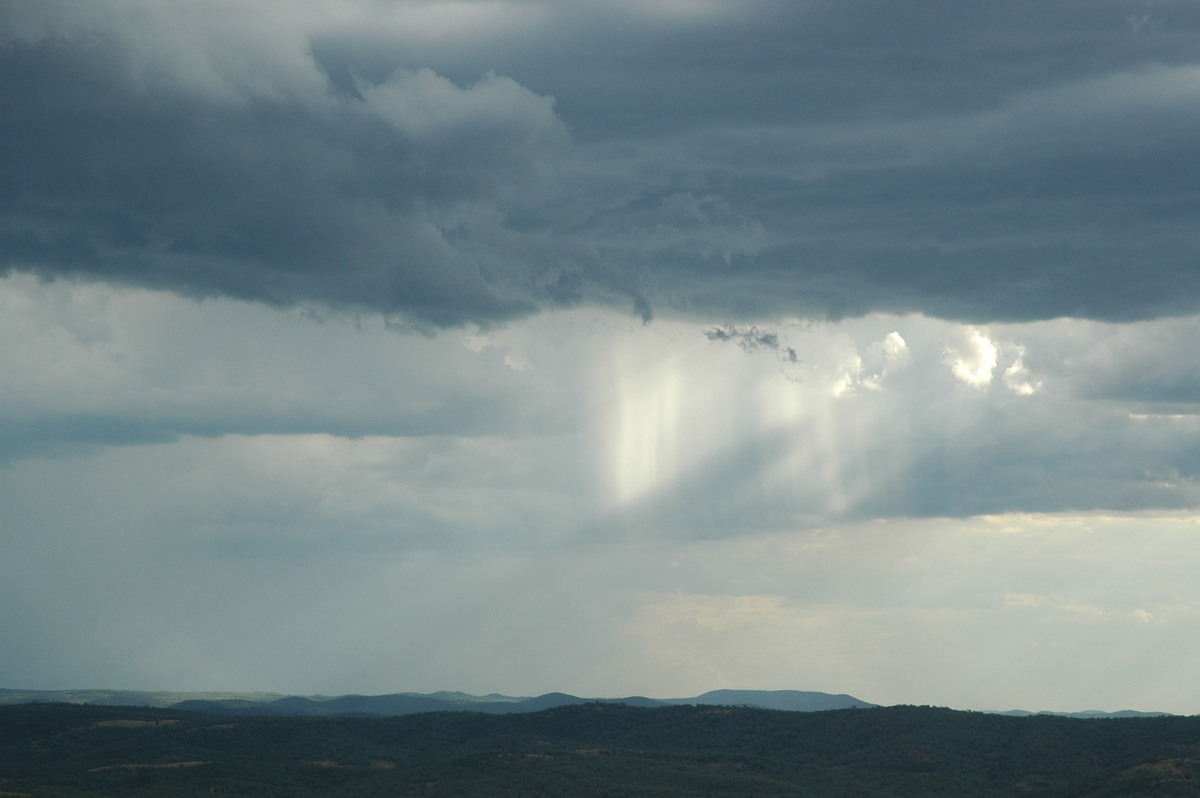
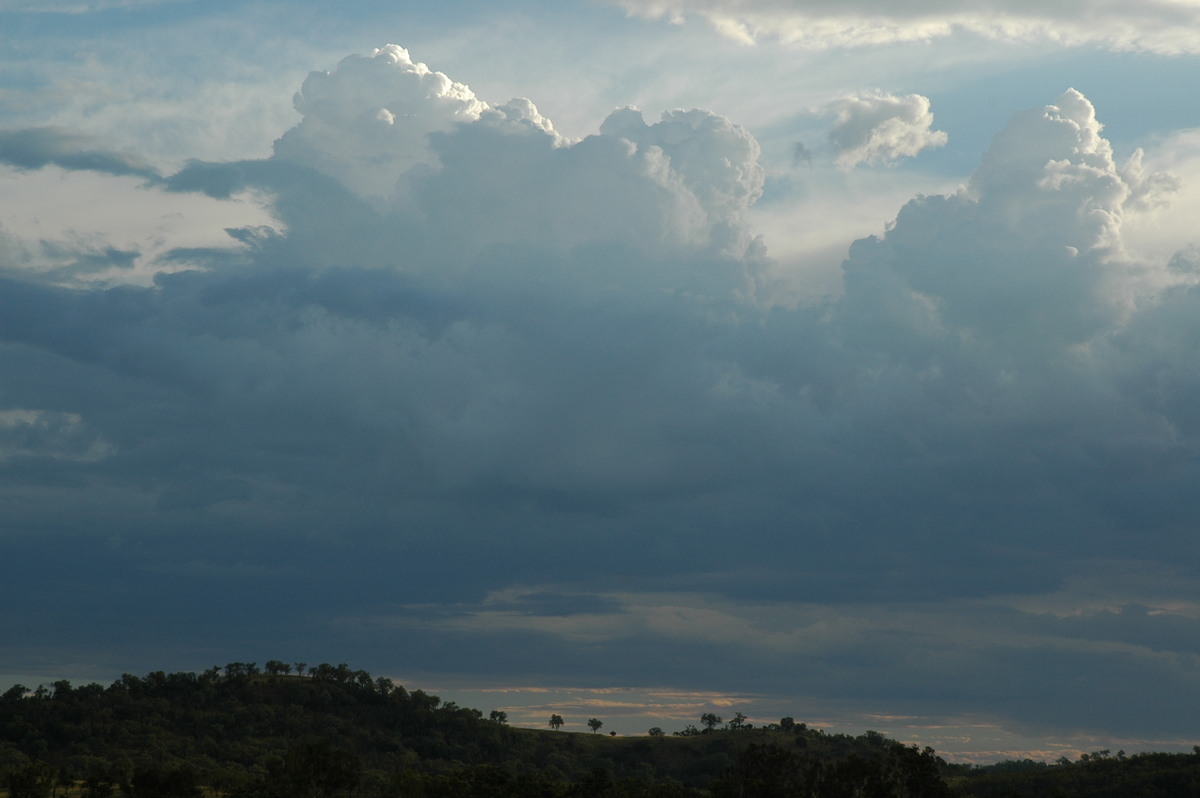
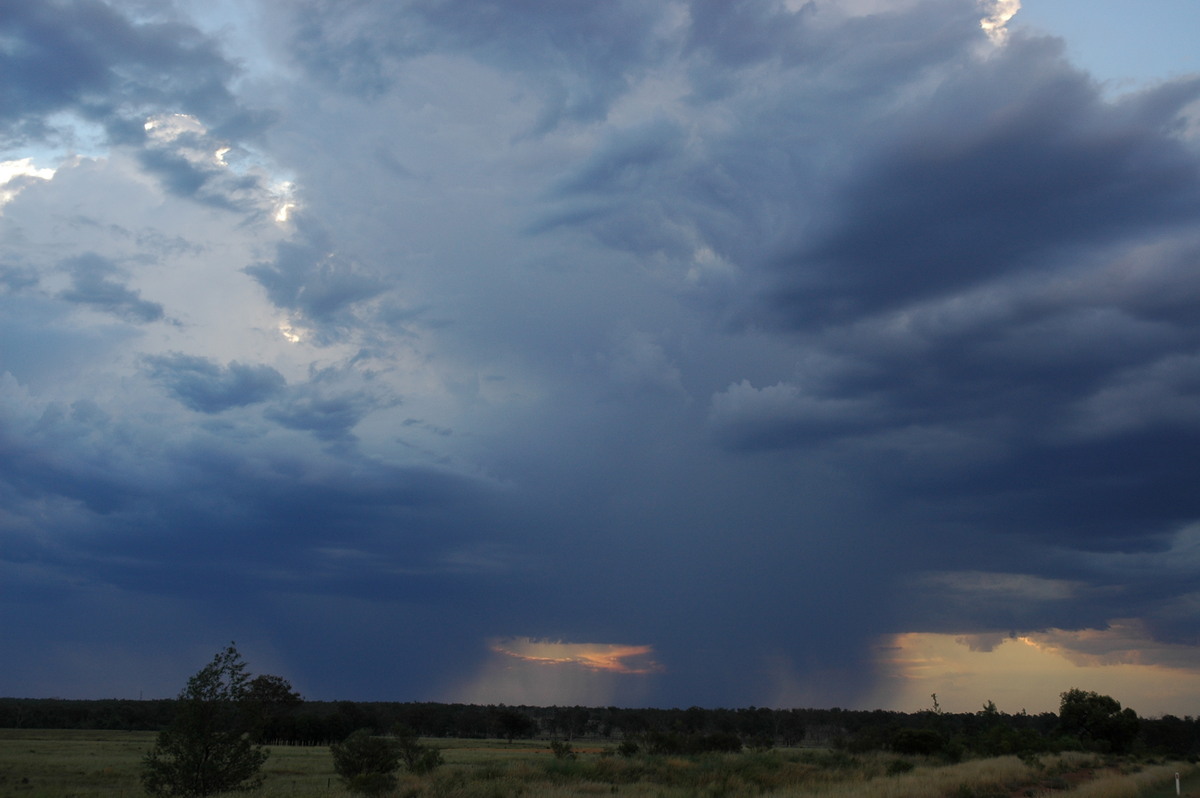
We stopped at Deepwater as storm activity started to become widespread. The scene was quite spectacular but the original cell had weakened by now.
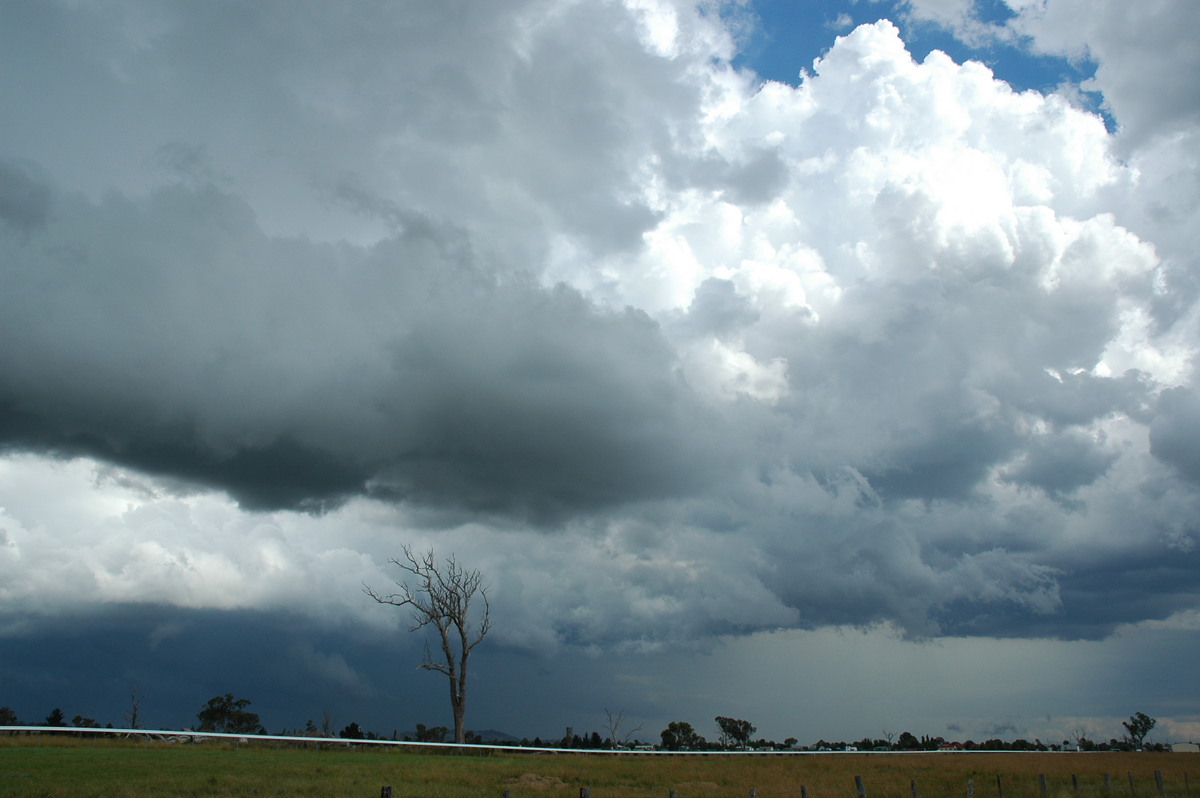
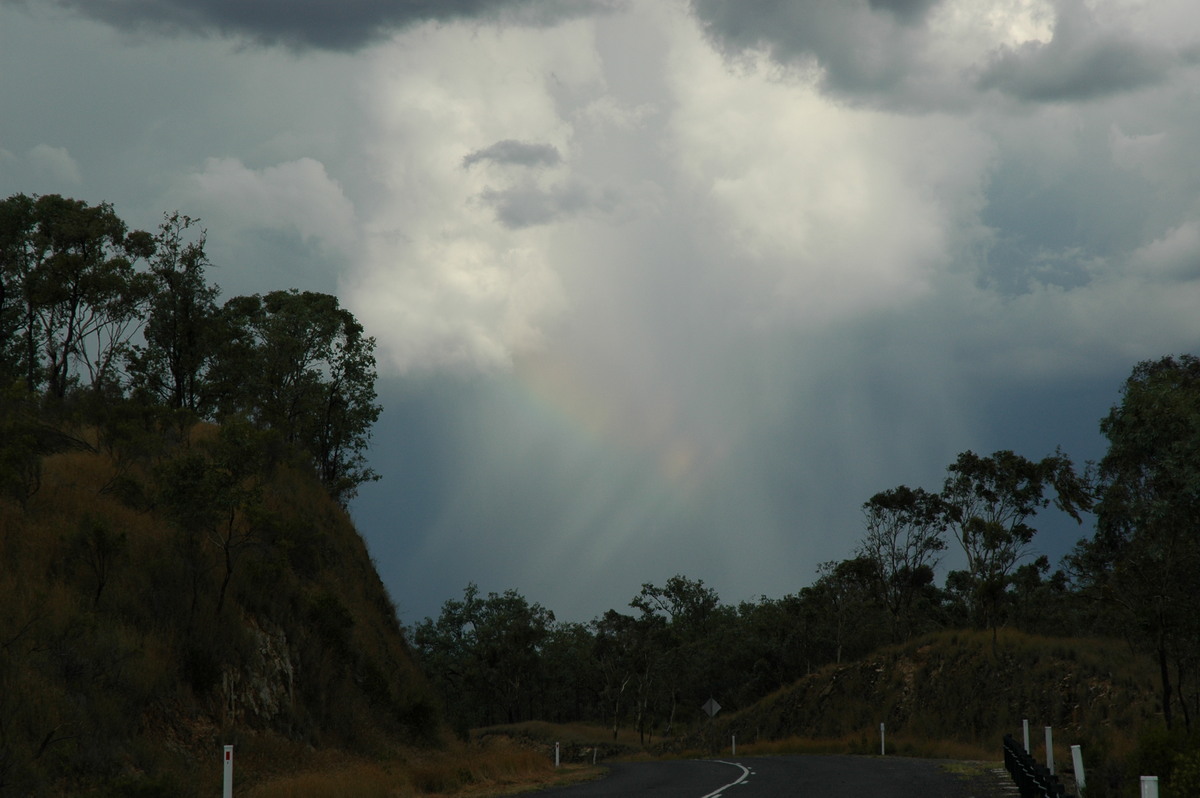
Very strong SE winds spread across the entire stretch between Glen Innes and Tenterfield, many braches were brought down and some large trees as well. The surge of SE'ers kicked up cells everywhere and it was certainly a dash to save the Rav 4 from what appeared to be hail shafts. At this stage it was a worry if the whole area would just become clouded in but the chase continued west along the Bruxner Highway from Tenterfield.
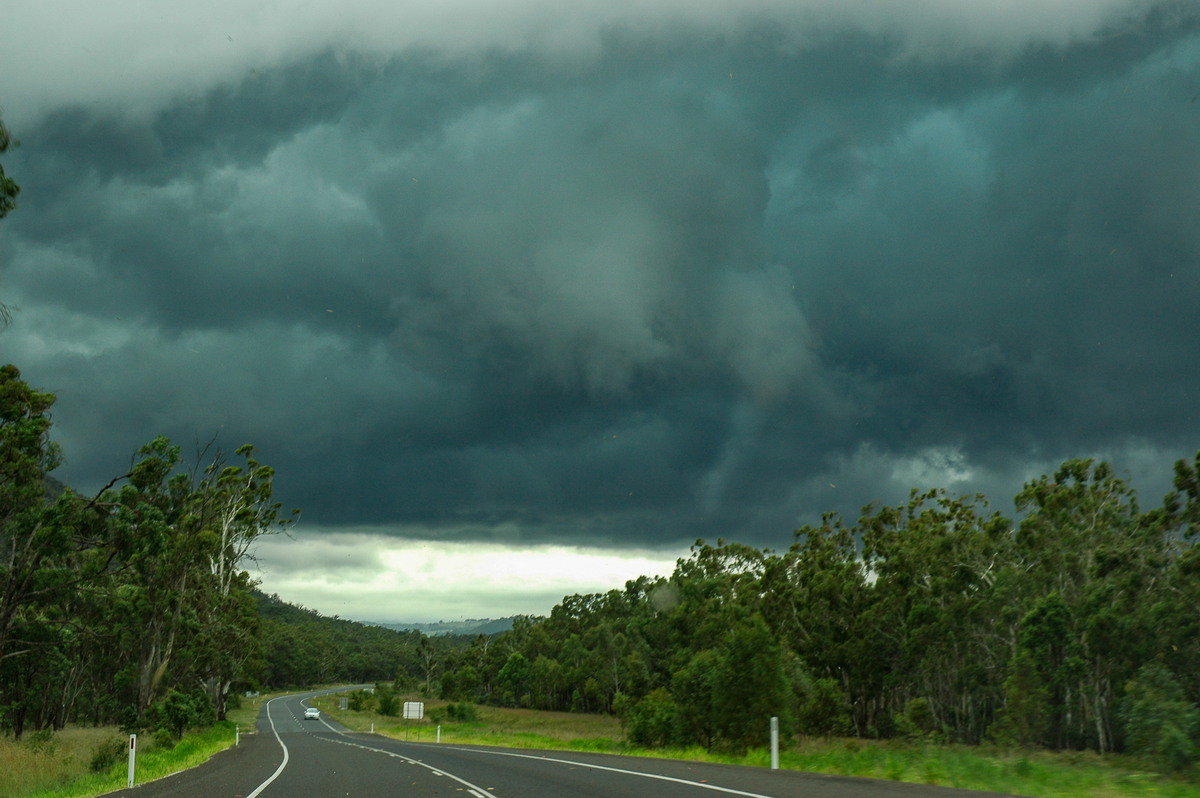
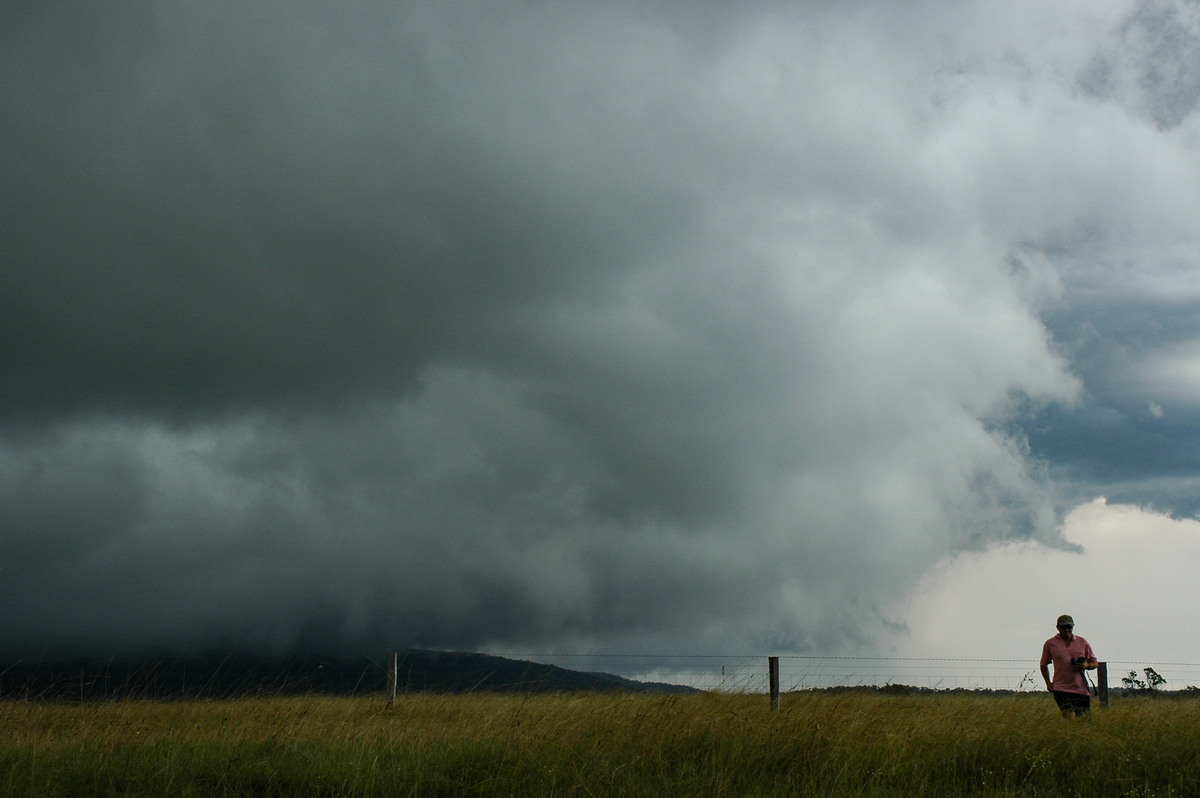
Storm after storm shot up along the boundary. We mostly kept just ahead of it all and eventually made it completely out of the SE influence near Bonshaw.
Activity had largely died off at this stage, but CJs were persisting to the SW and W.
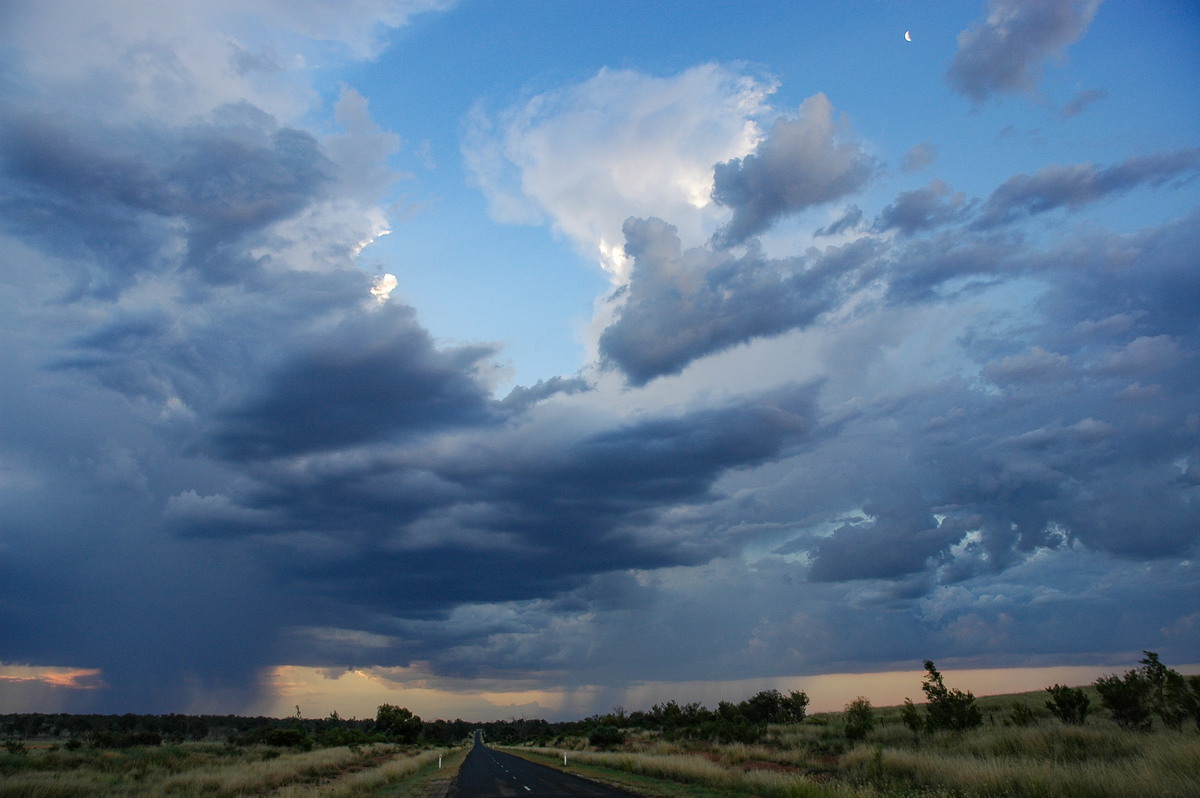
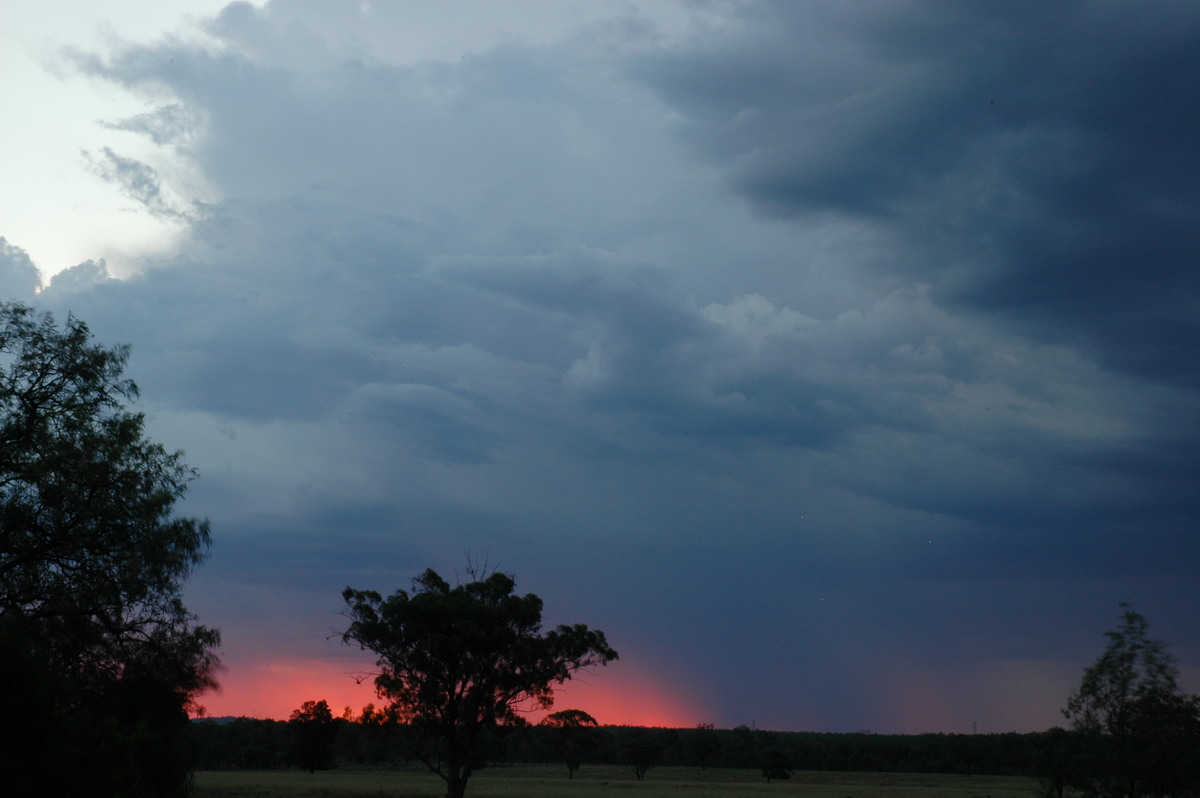
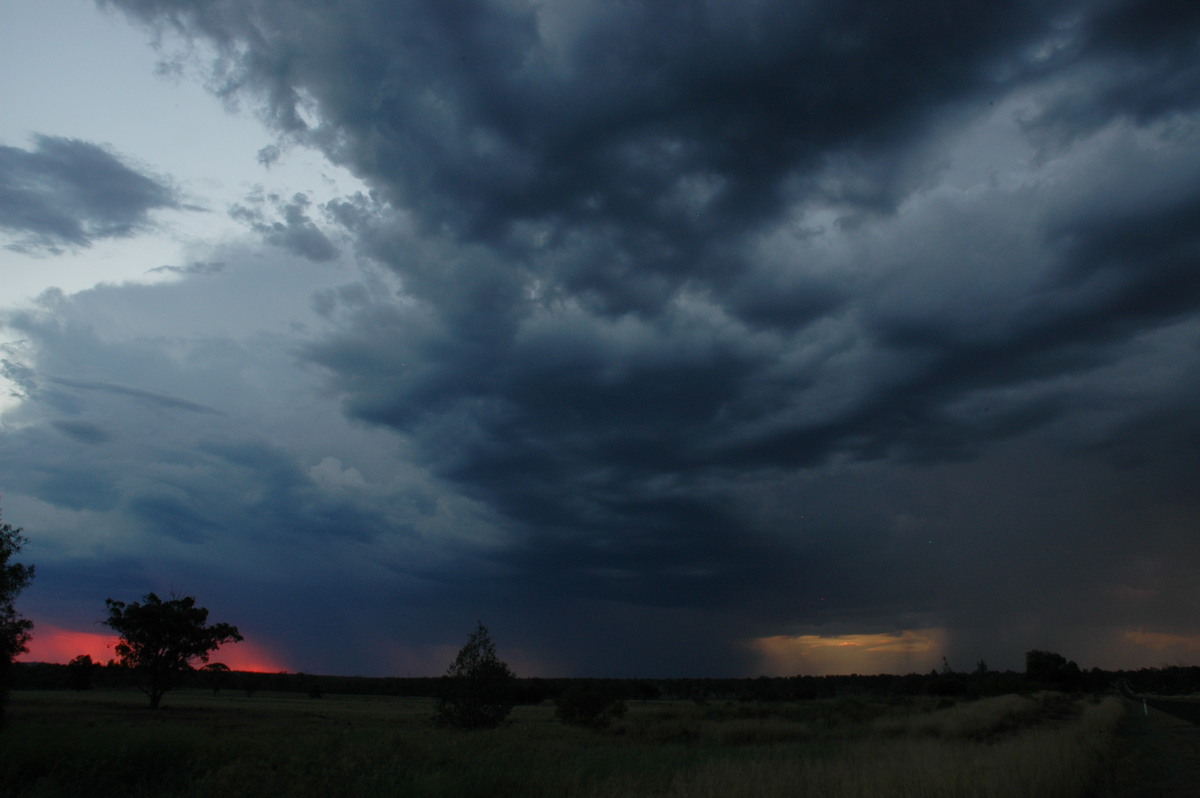
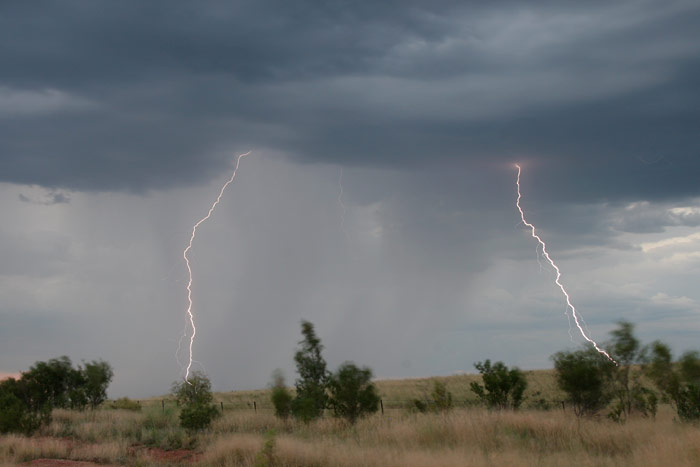
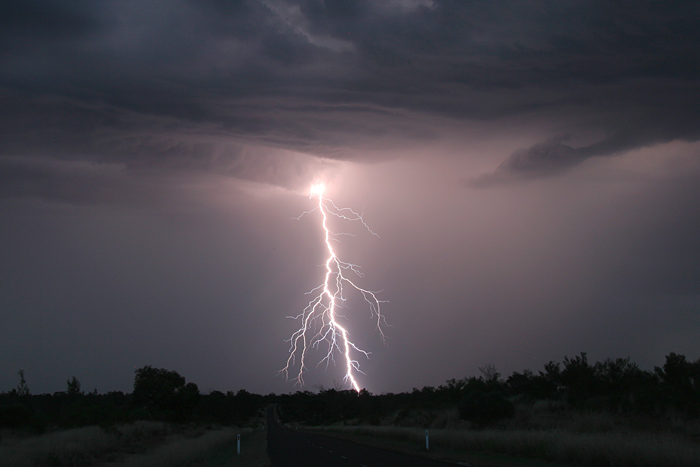
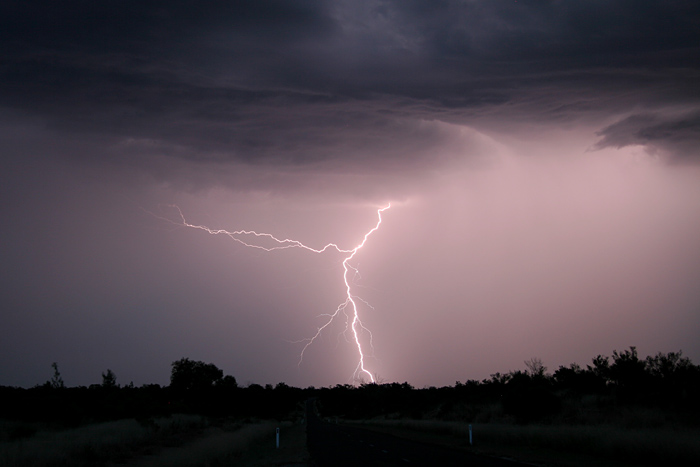
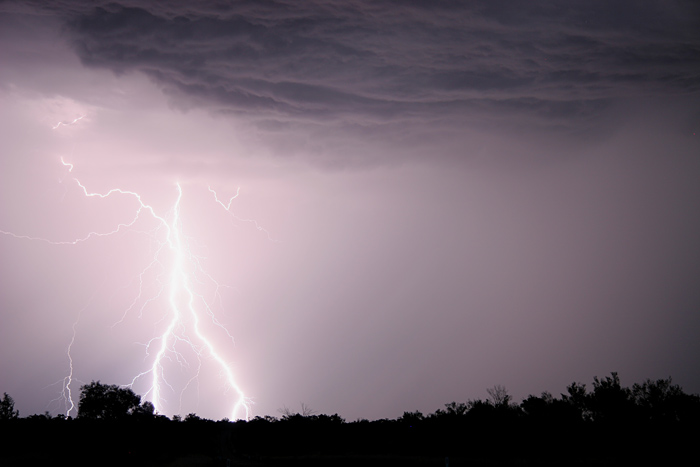
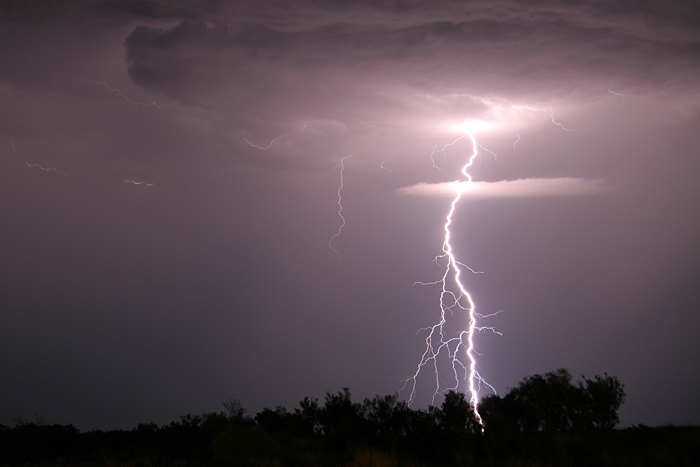
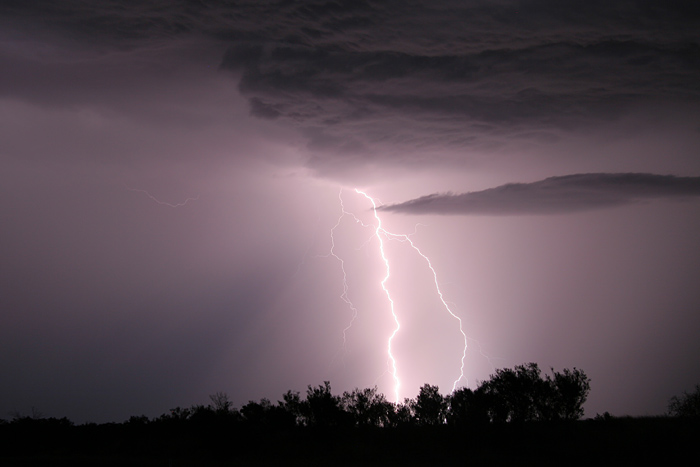
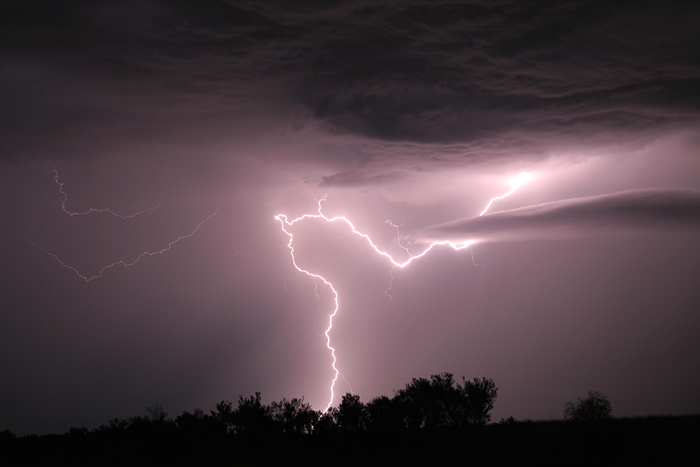
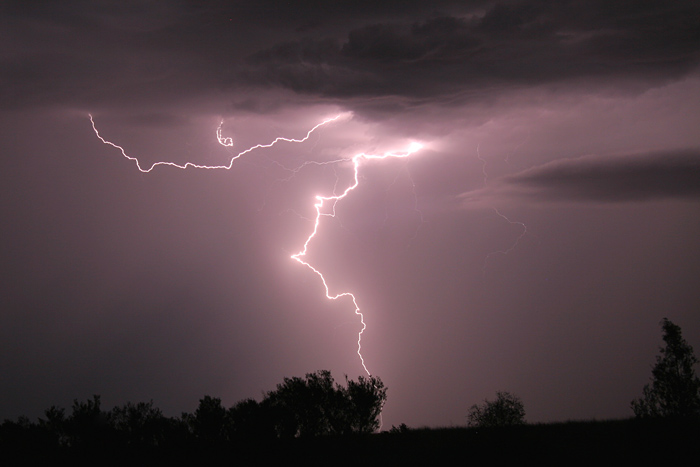
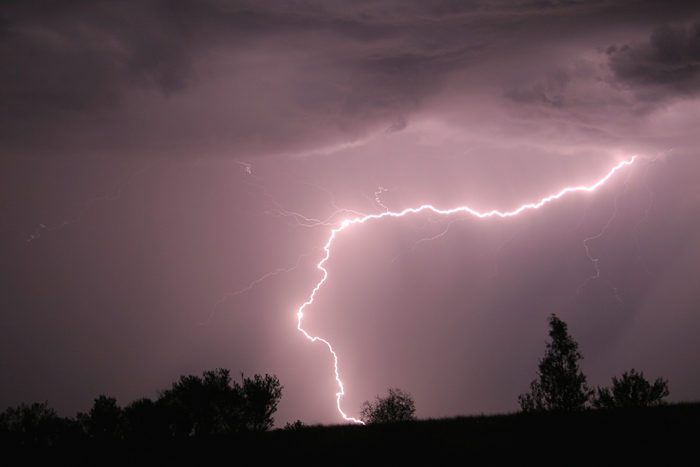
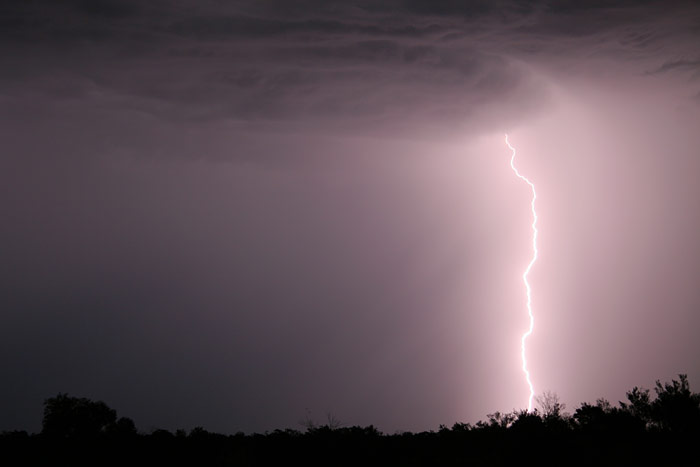
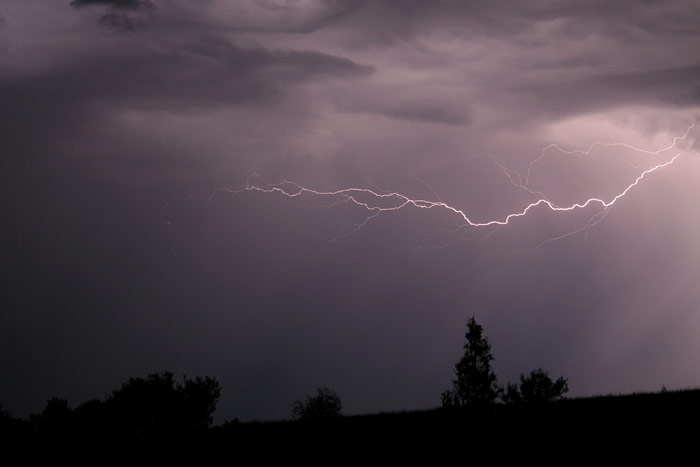
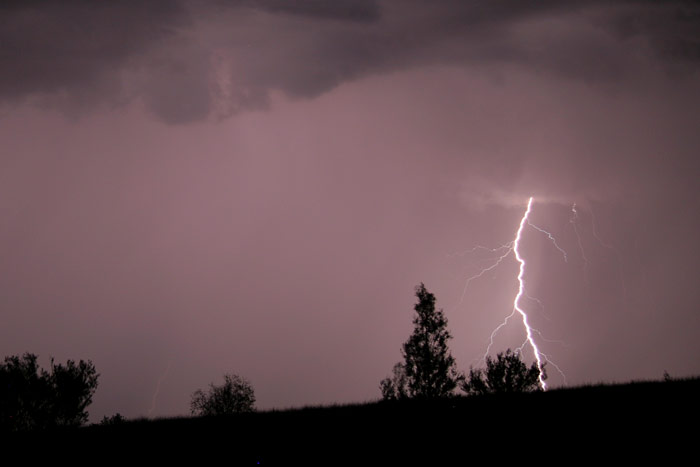
Just on evening a couple of slow moving storms got going near Texas. These cells were forming in a quite different environment to earlier, and exhibited higher based features. It was an ideal setting and provided us with an awesome lightning display until about 9pm.
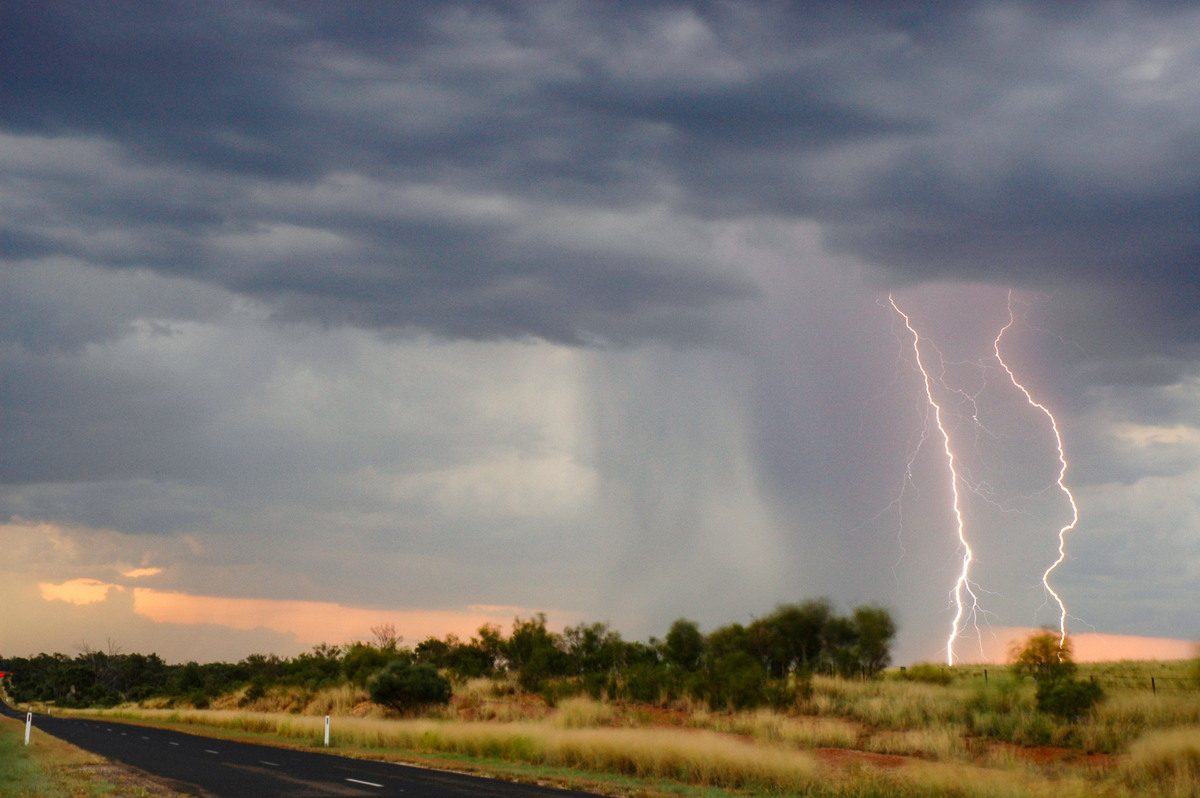
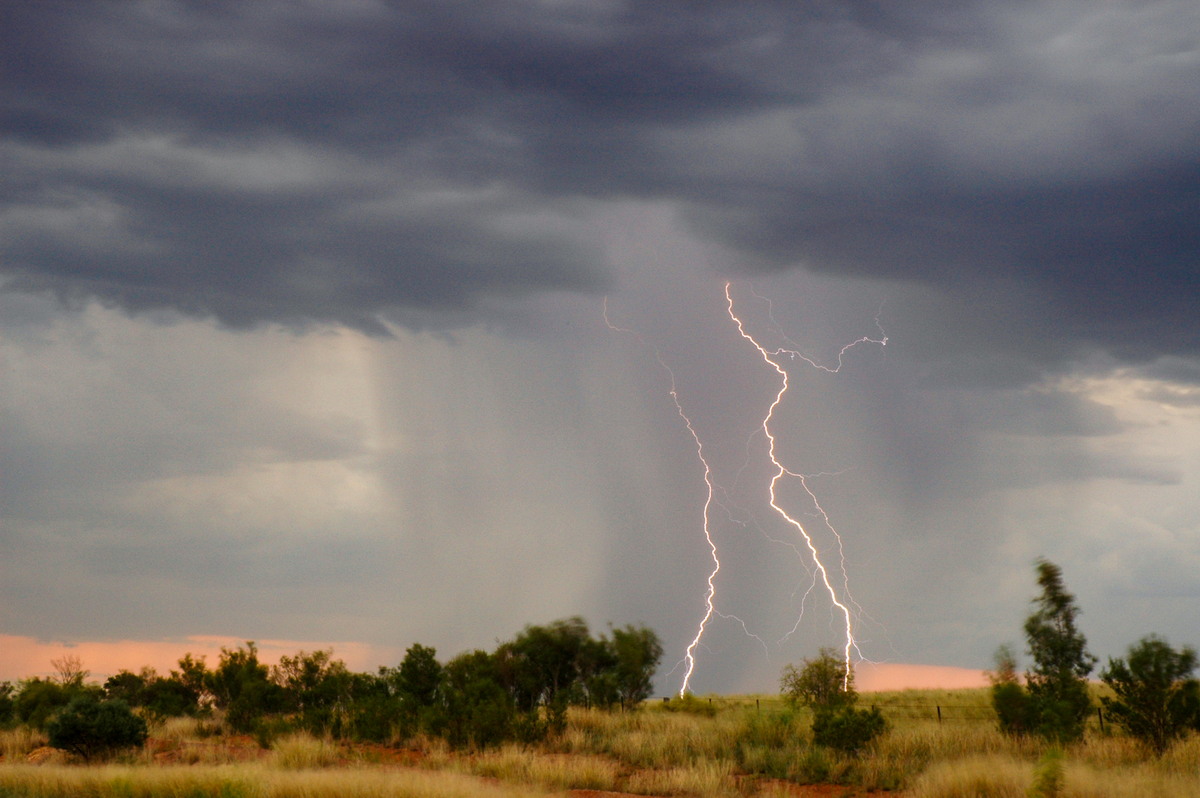
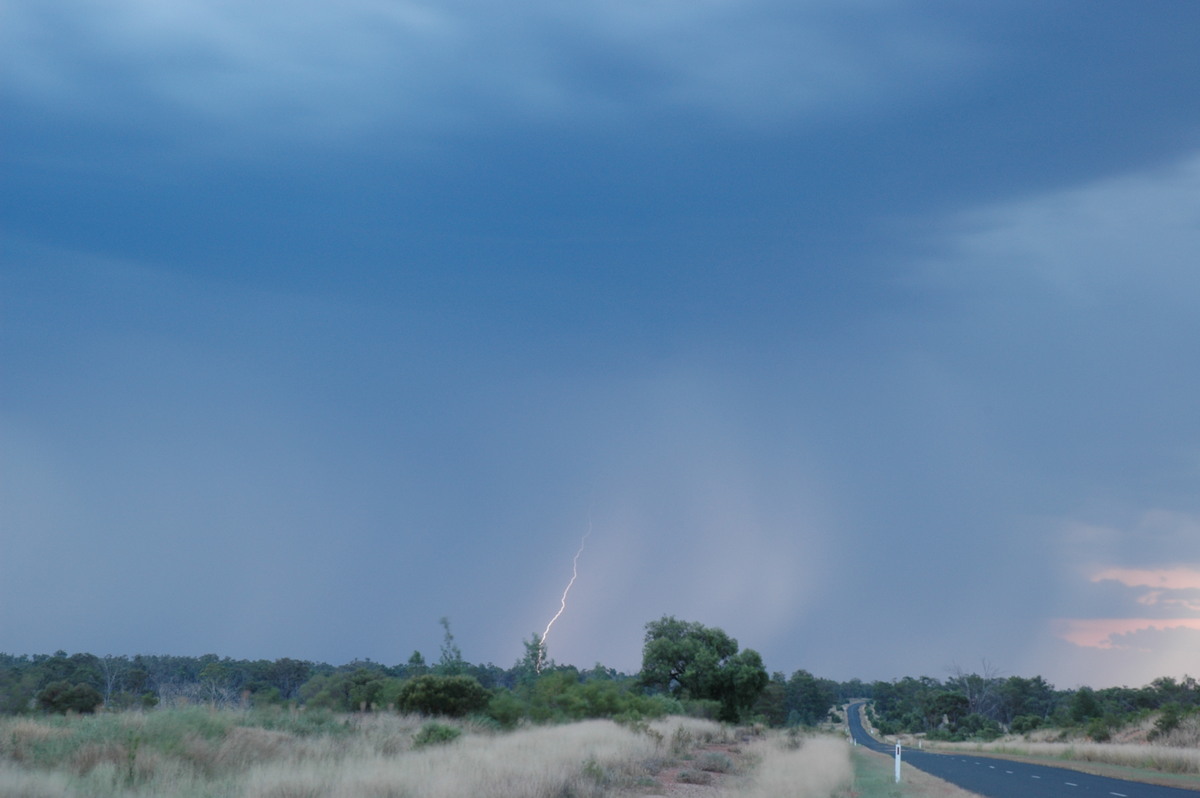
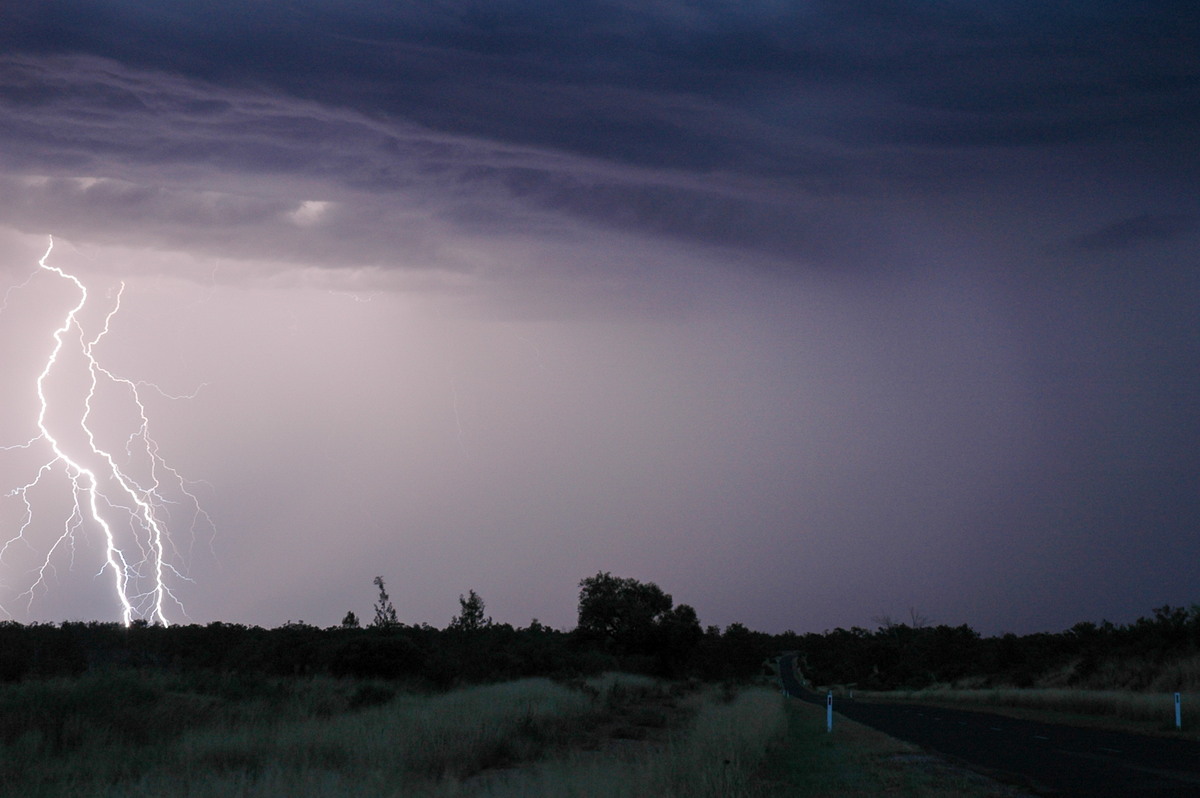
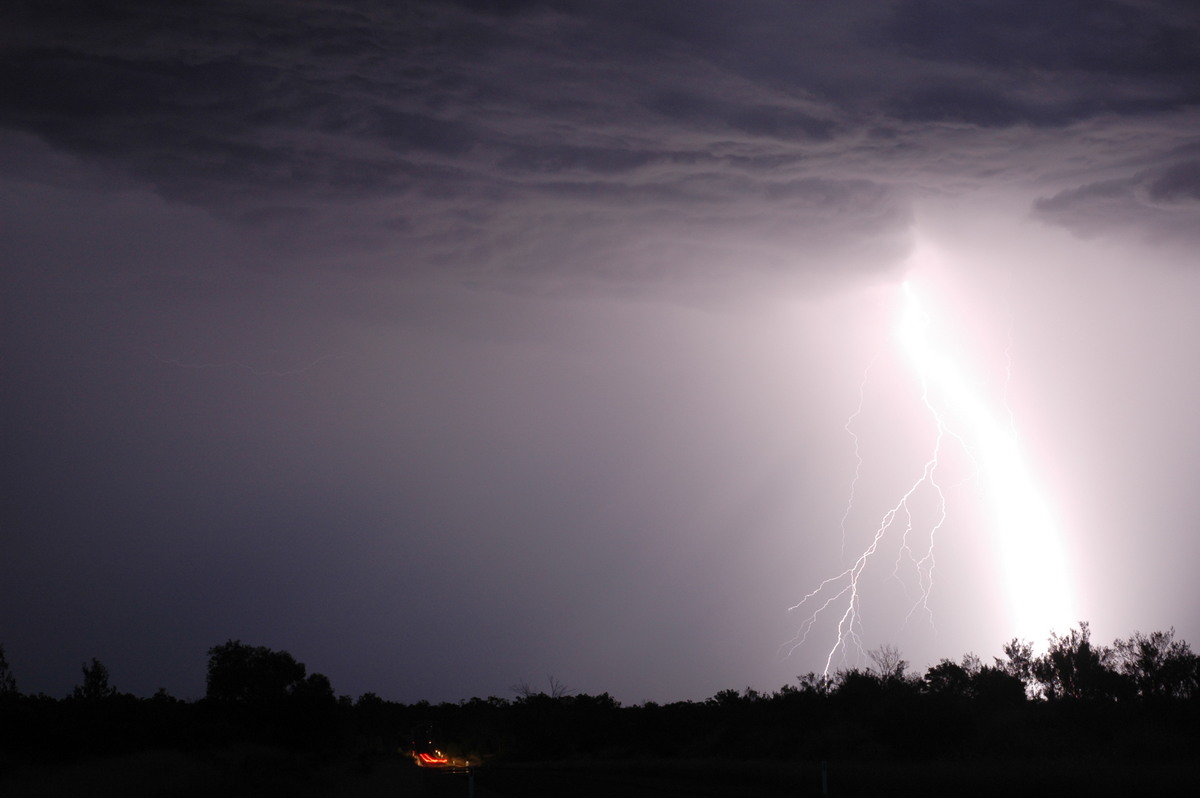
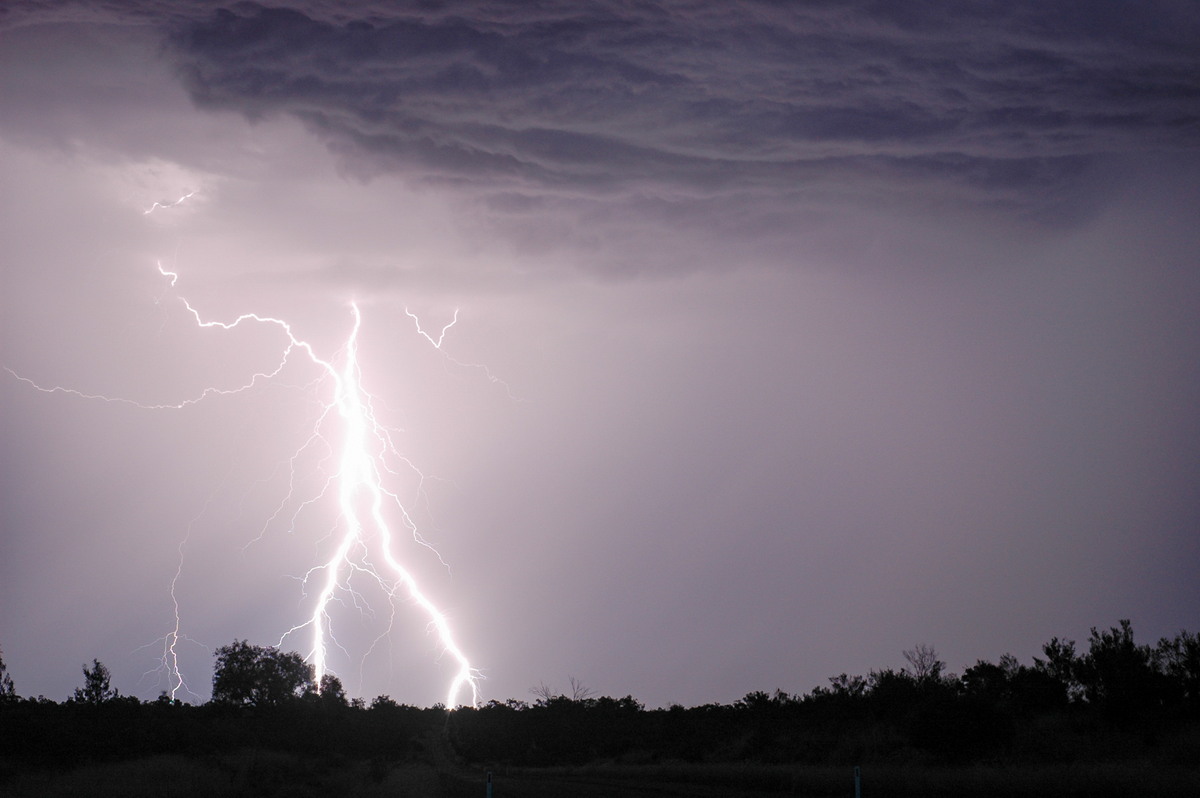
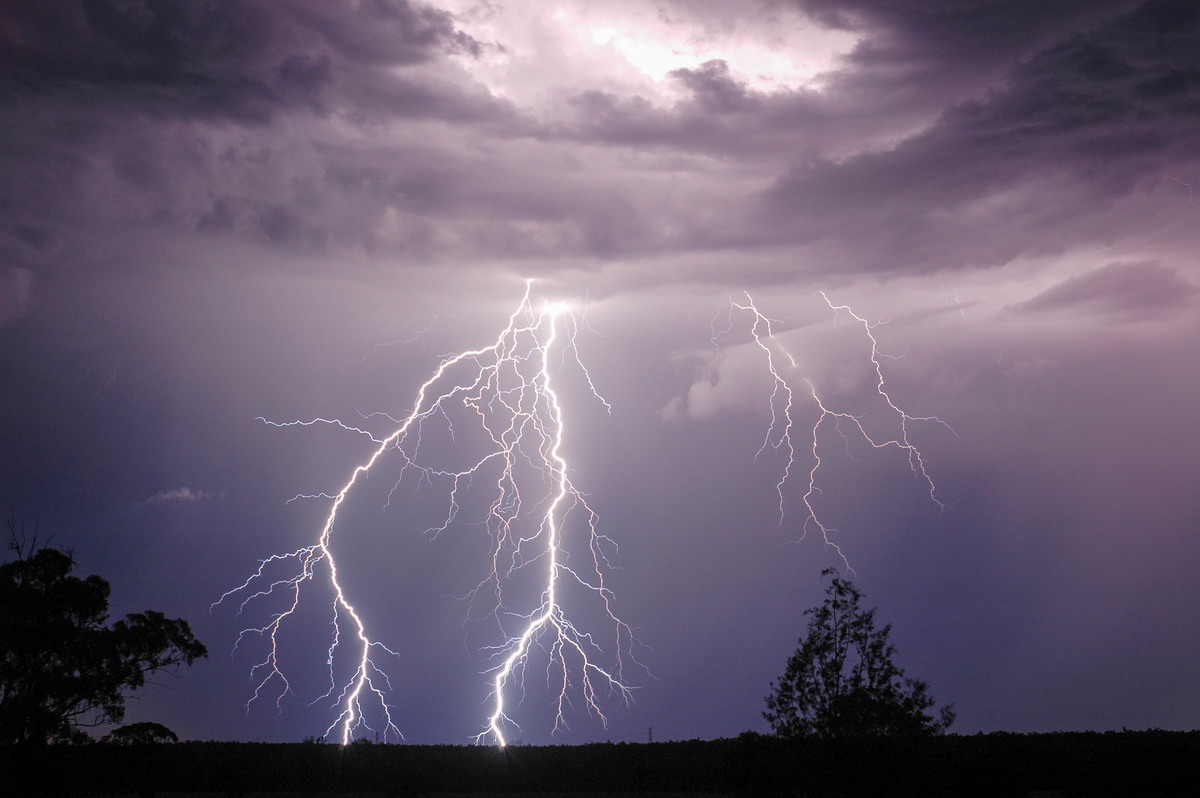
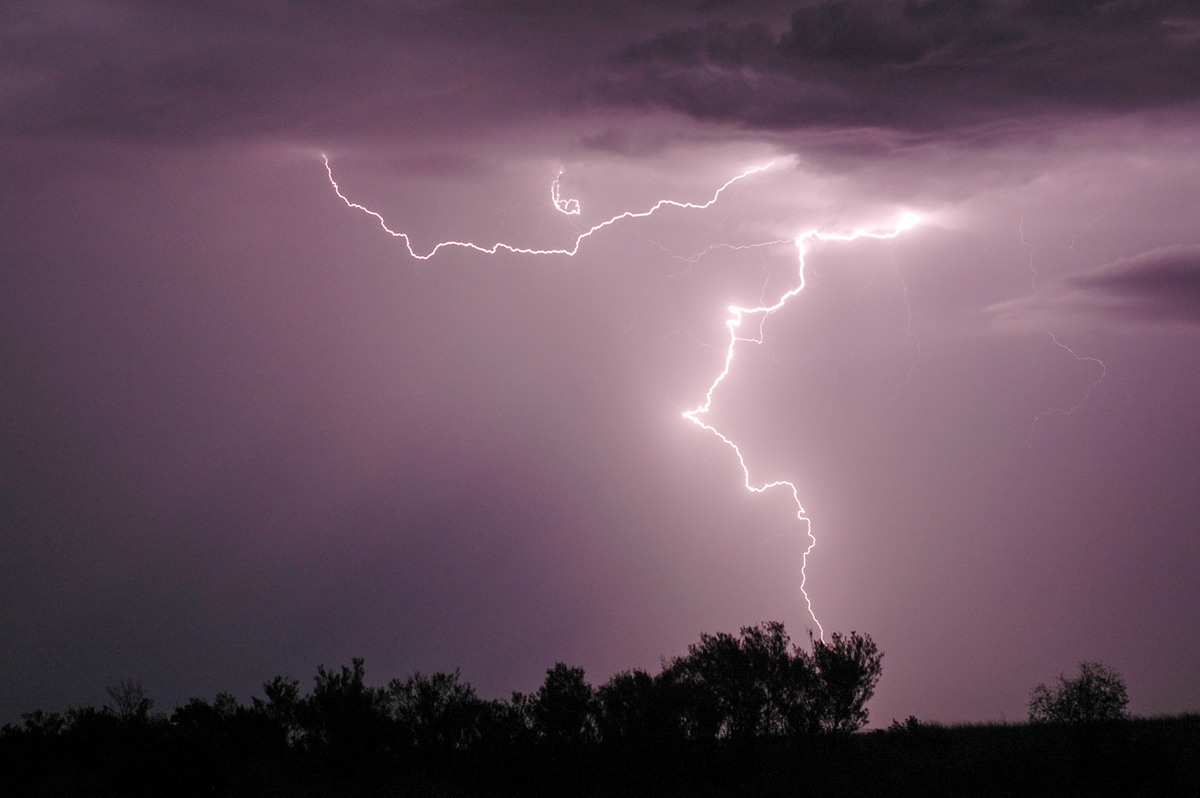
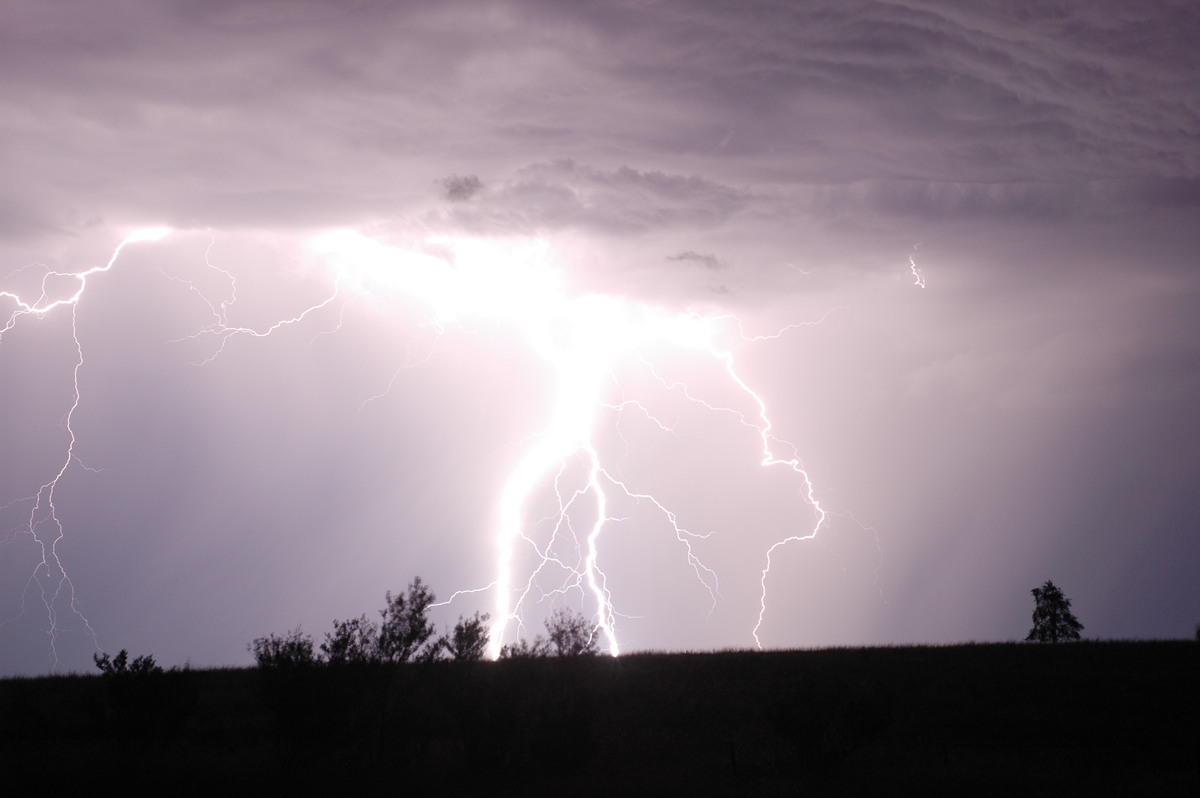
These are Dave Ellem's favourites from the lightning display:
It was a very rewarding, long and excited Northern Tablelands chase day. We covered 800km though we almost didn't make it home: fuel had been knocked out at Tenterfield due to the storms. We just made it back to the next 24 hour fuel at Casino with about 1-2 litres of fuel remaining.
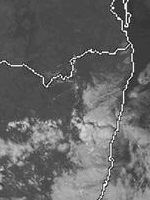
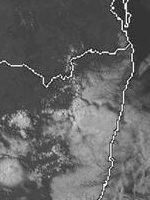
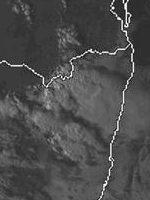
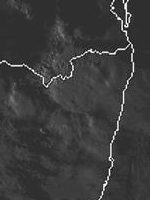
From Weatherzone
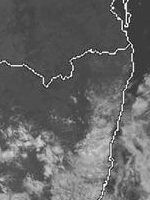
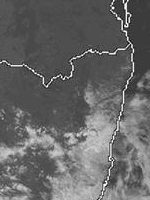
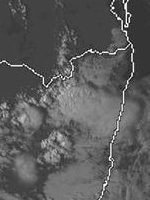
 1pm to 7pm local
From Bureau of Meteorology
 Moree sounding at 11am 04/02 local
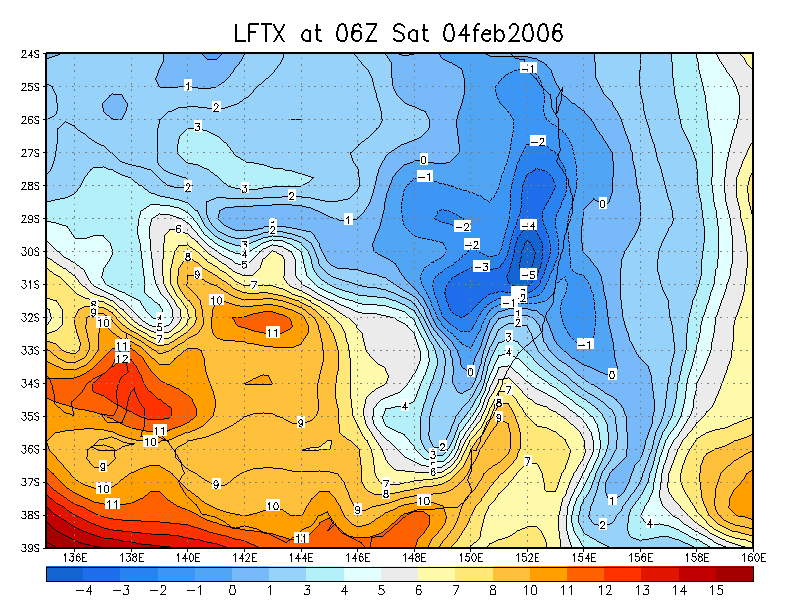
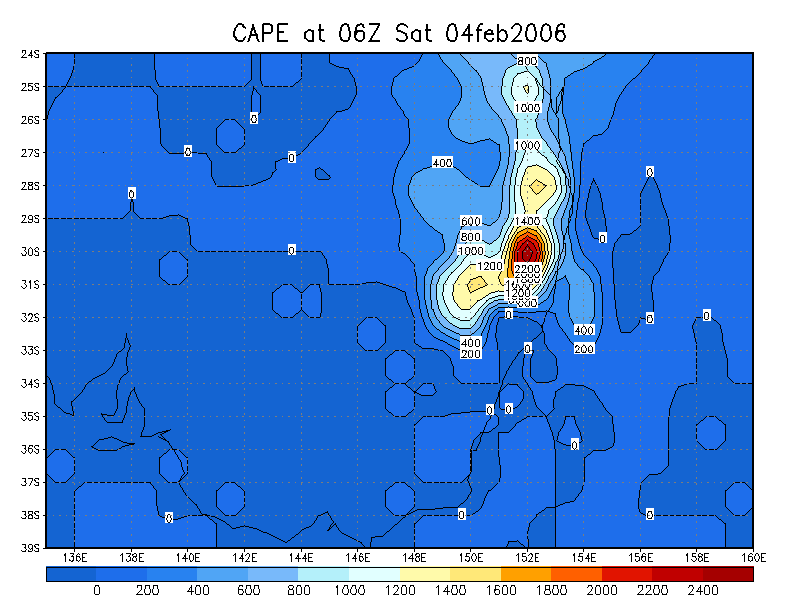
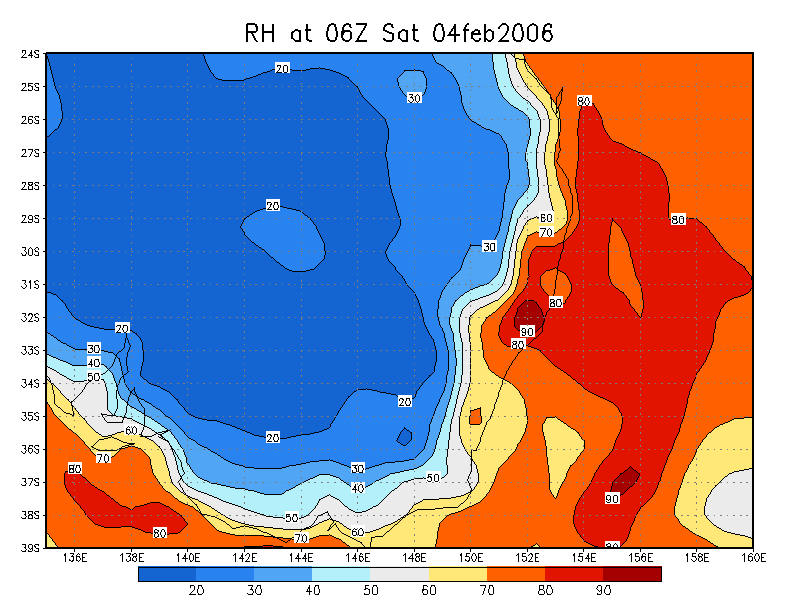
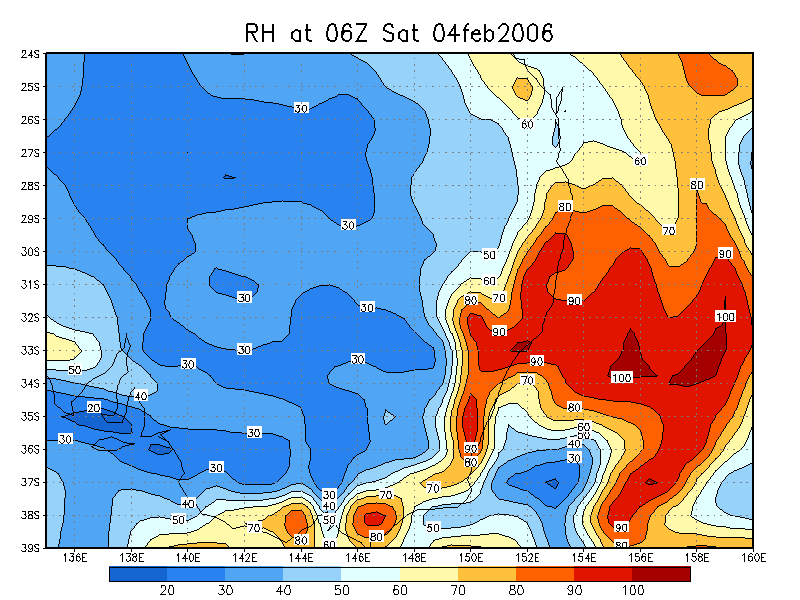
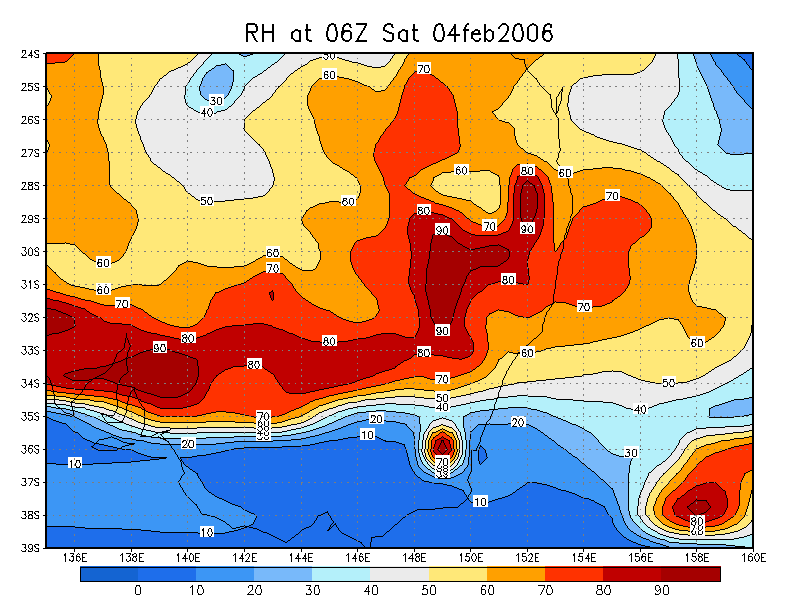
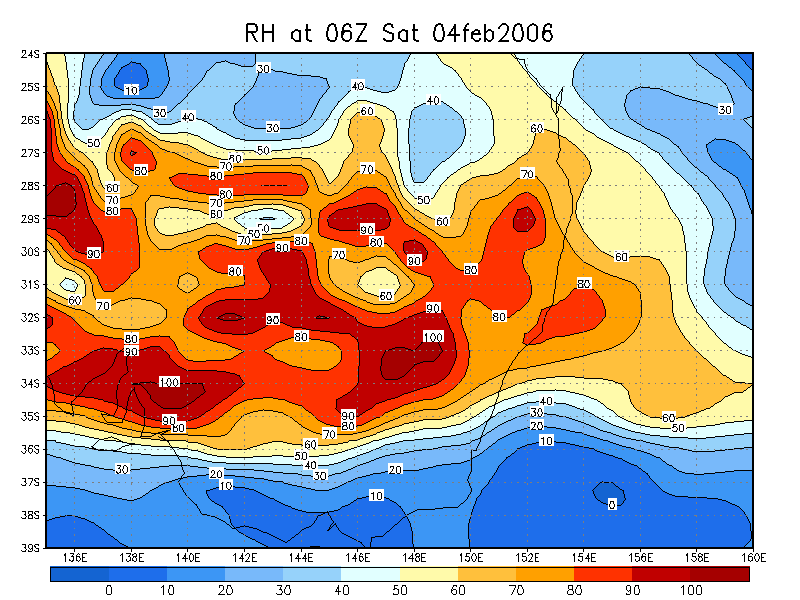
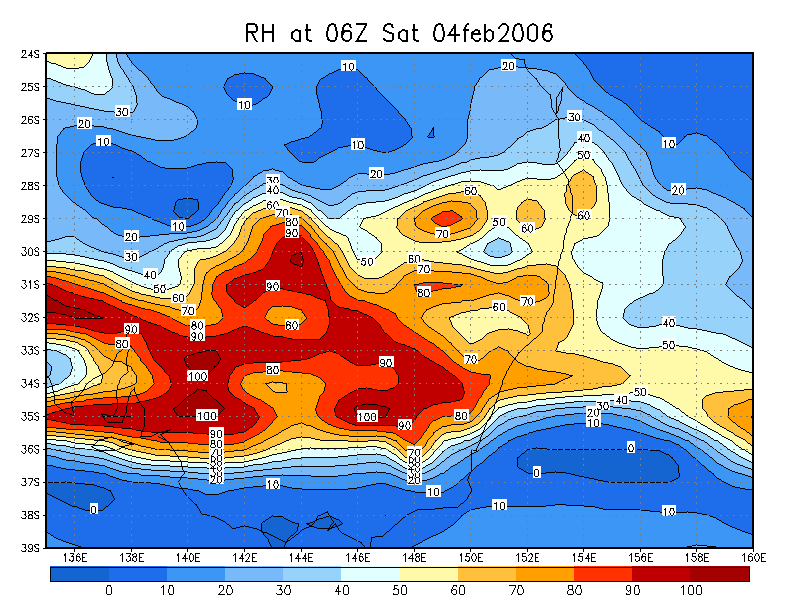
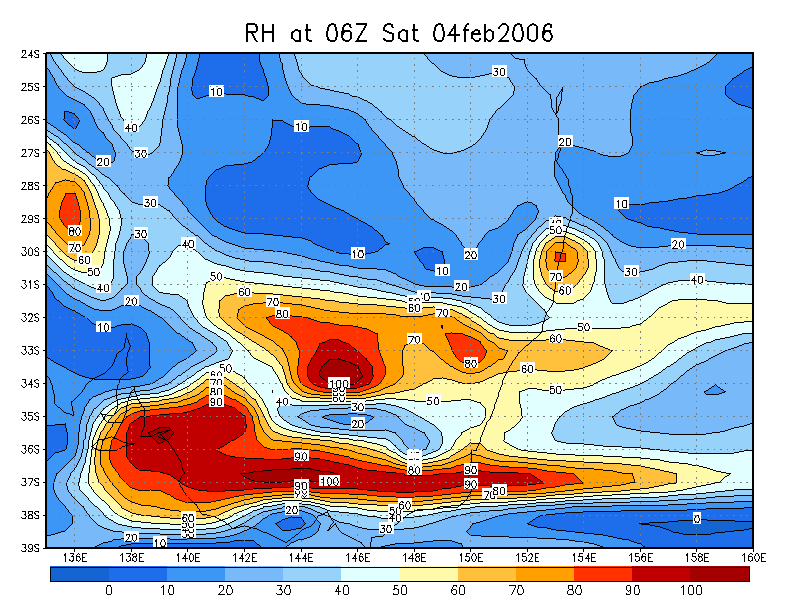
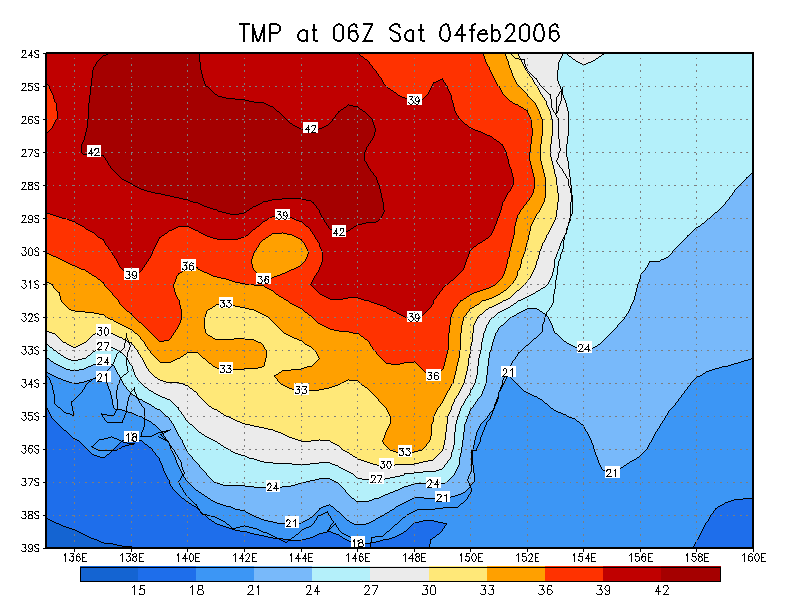
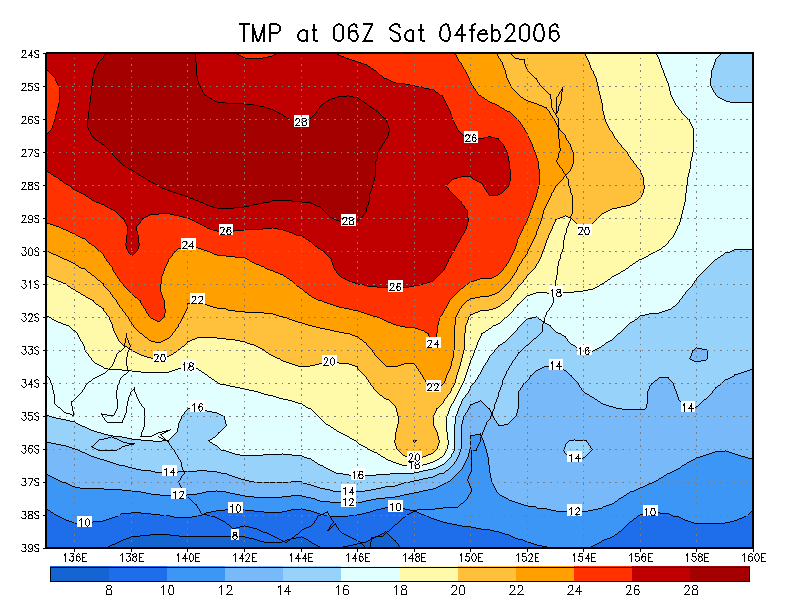
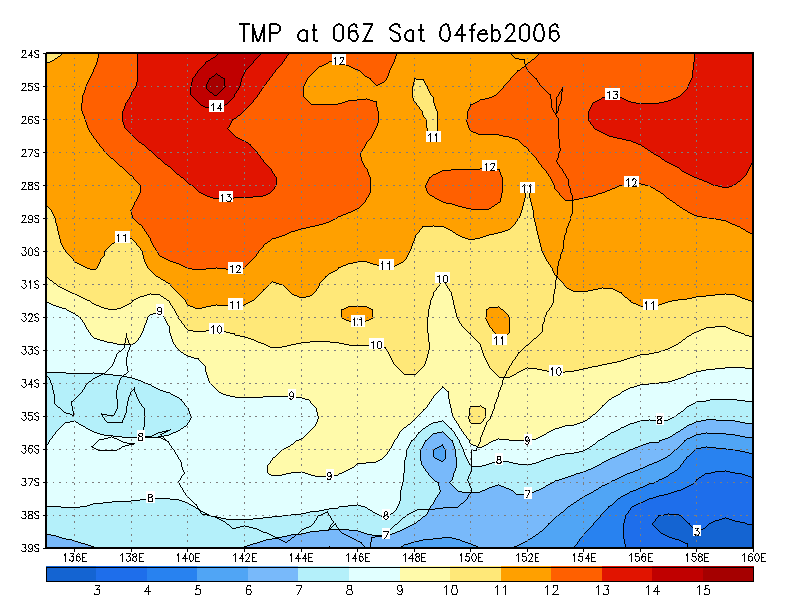
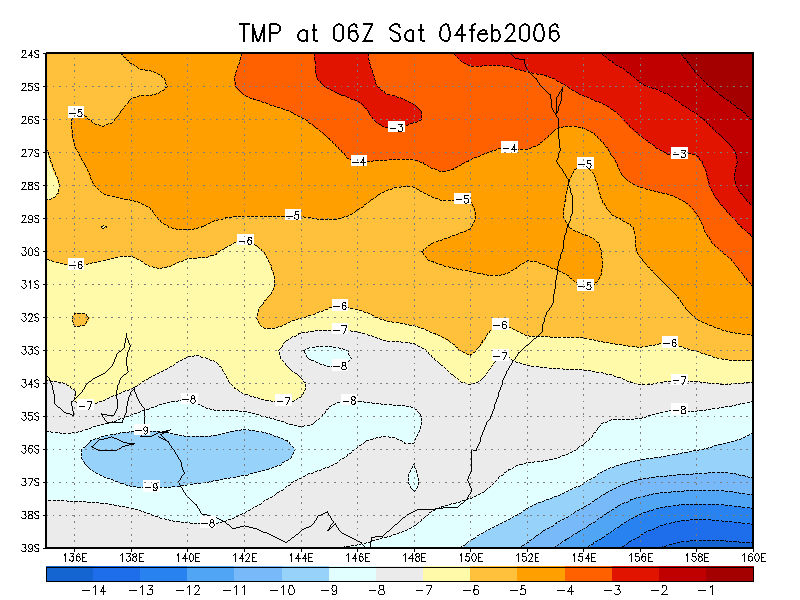
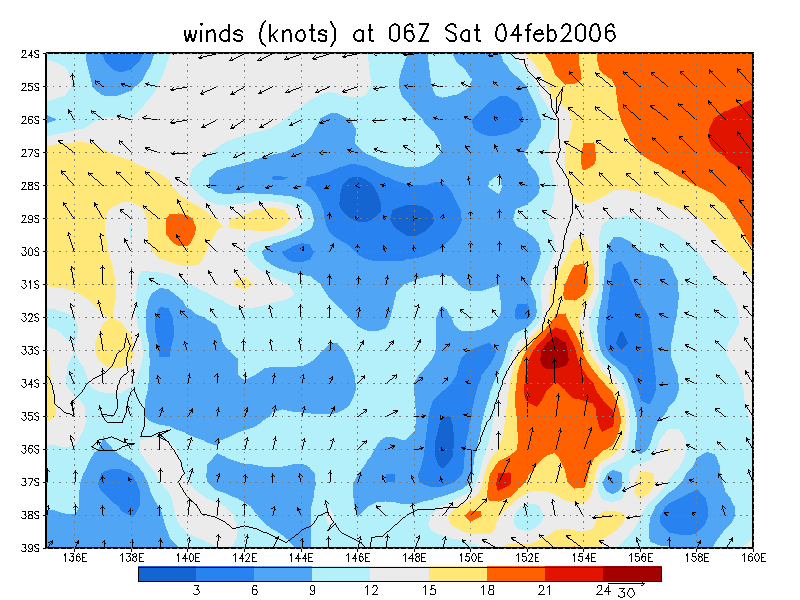
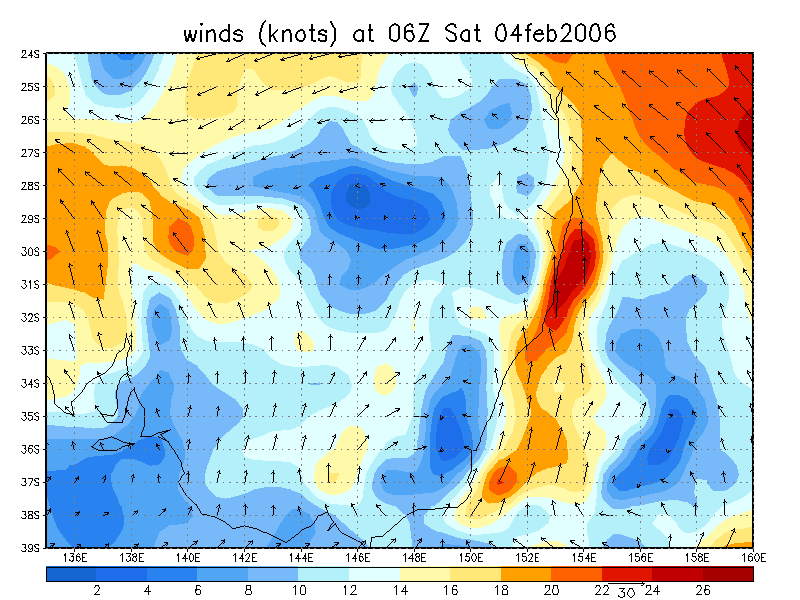
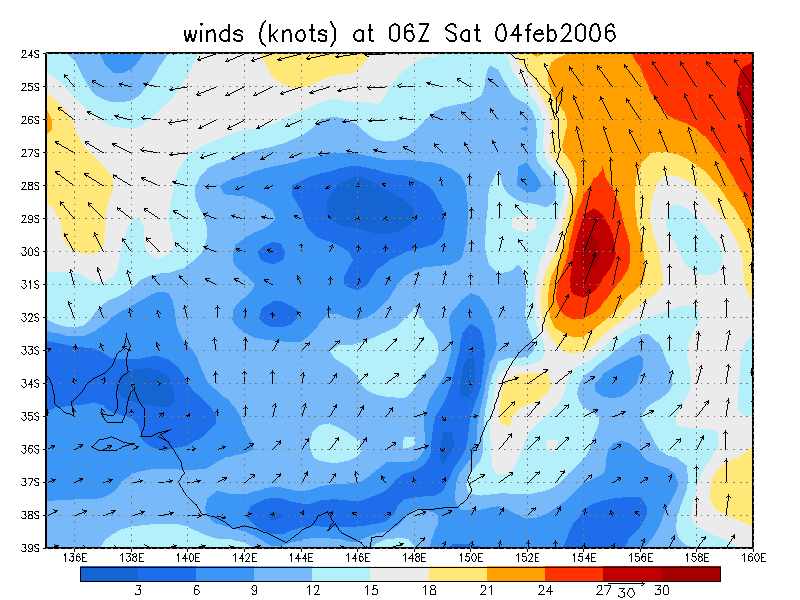
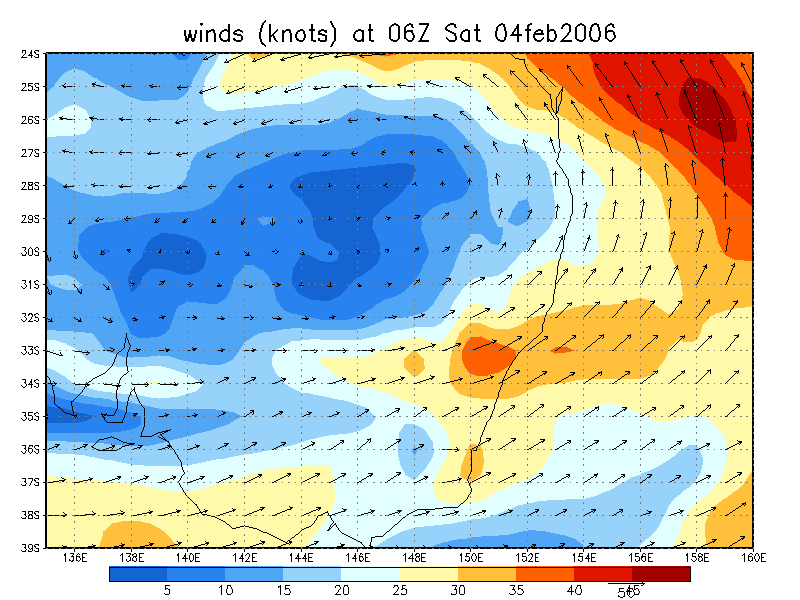
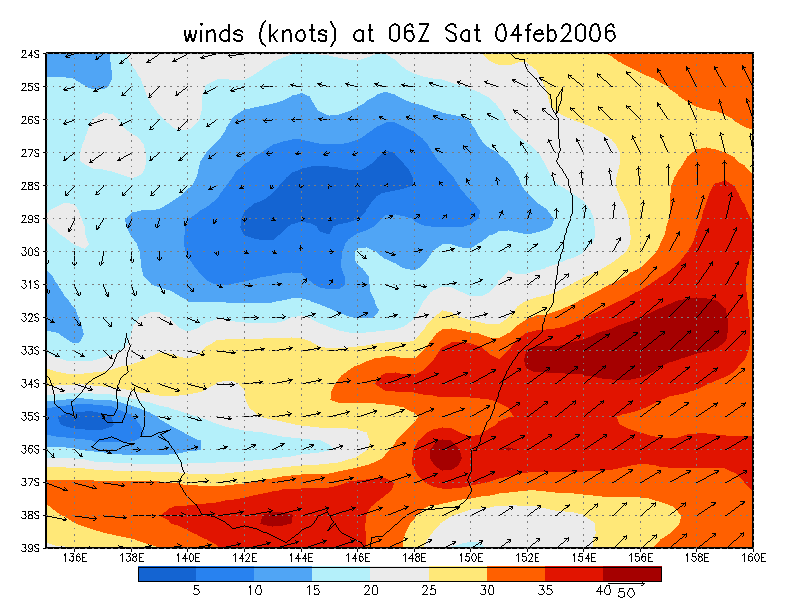
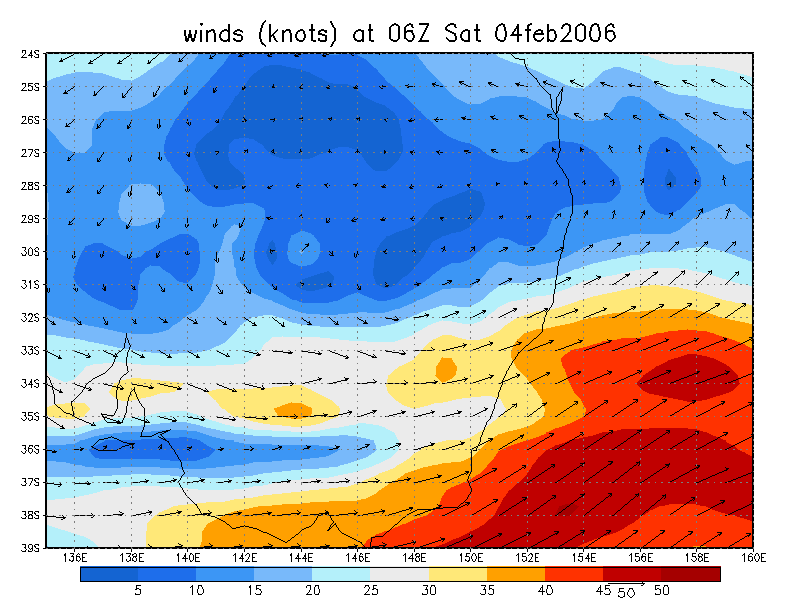
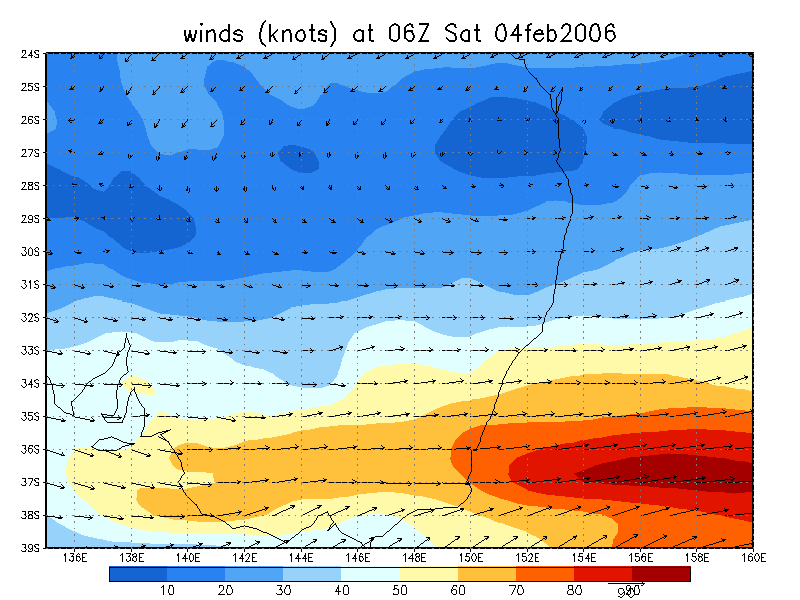
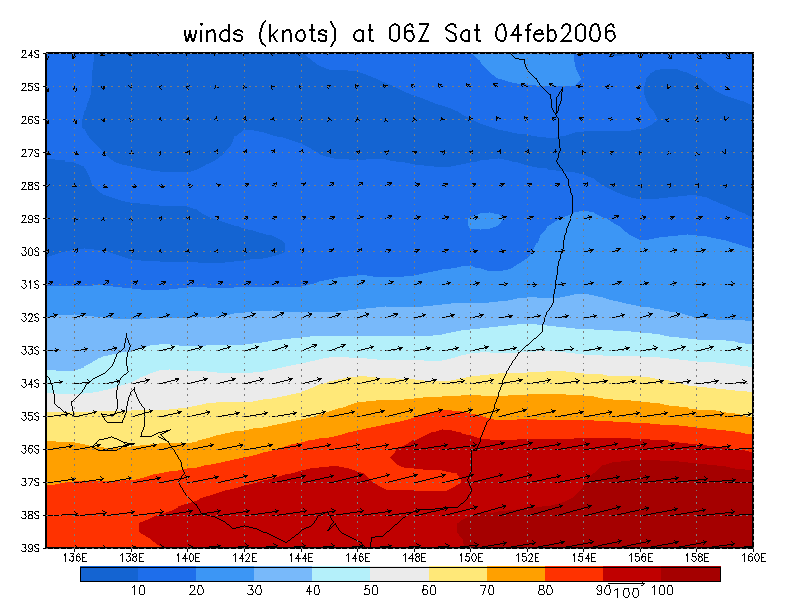
From NOAA 04/02/2006 06z analysis
|
Document: 200602-01.htm Updated: 28th February 2006 |
[Australian Severe Weather index] [Copyright Notice] [Email Contacts] [Search This Site] |